X-ray Microscopic Examination of a Giraffe Molar
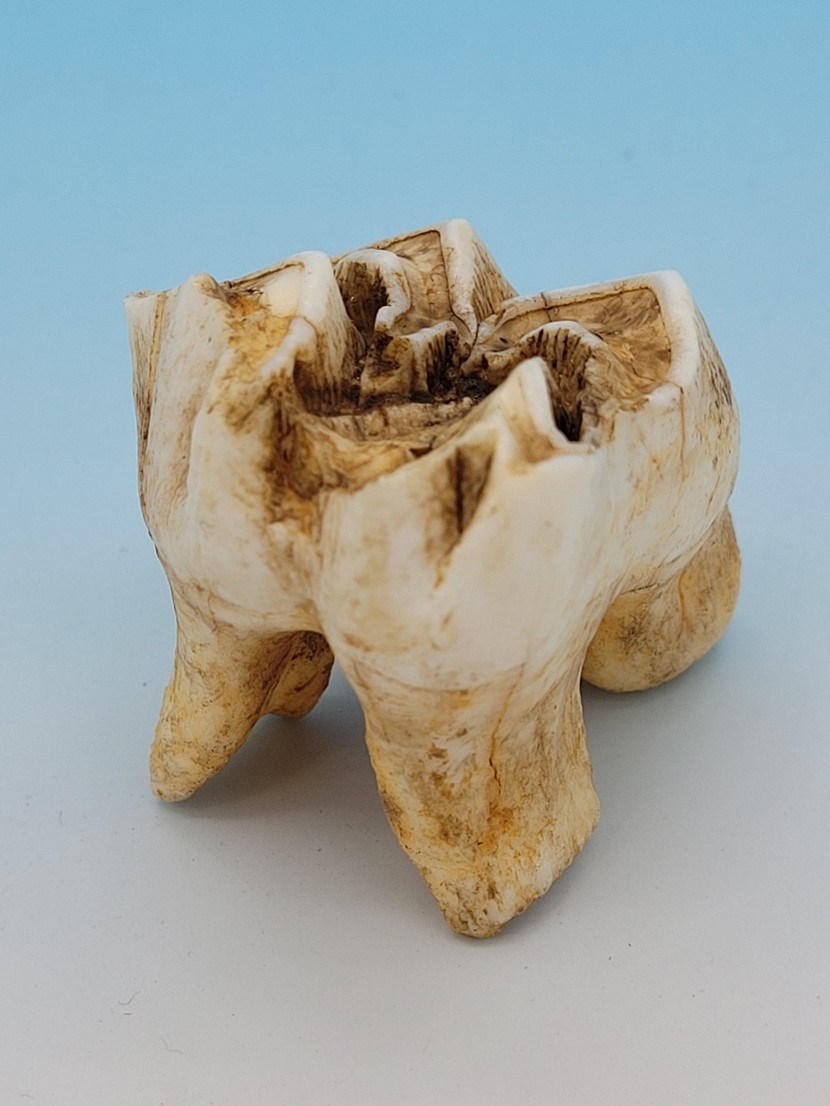
Figure 1: Photograph of the giraffe molar imaged in this studyAdapted for browsing on the tough, drought-resistant leaves and twigs of acacia species in African savannah ecosystems, giraffes possess molars characterized by relatively low crowns, broad rounded cusps, and thick enamel ridges. These features facilitate the mechanical breakdown of fibrous plant material for digestion. Browsers (leaf-eaters) consume woody vegetation and broadleaf plants common in woodland, savannah, and forest-edge habitats, as opposed to grazers (grass-eaters) who can be found in grasslands and need high-crowned teeth as an adaptation to abrasion.
Morphological characteristics of fossil teeth provide critical evidence for dietary classification, allowing researchers to distinguish browsers from grazers and to infer associated habitat types (e.g., woodland versus grassland environments). Dental structure also offers insight into the evolutionary adaptations of the giraffe’s digestive system. In extant populations, analyses of tooth wear and microwear patterns can further inform assessments of dietary shifts, habitat change, and overall ecosystem health. Micro-CT is an excellent tool for these aspects of dental research.
Adult giraffes consume around seventy-five pounds of plant matter daily, using their long tongues to strip small branches and leaves from the trees. Like other ruminants, giraffes spend considerable time digesting each meal but generally consume less plant material than other herbivores due to the nutrient dense food sources available to them and their efficient digestive processing.1
X-Ray Microscopic Imaging – High Resolution Imaging of Dental Samples
Dental samples commonly are imagined with micro-CT primarily because of the high resolution of the final images as opposed to more common in-vivo imaging techniques, like cone beam CT. For this study, the giraffe molar dataset was acquired using our SkyScan 1273 at an isotropic voxel size of 20 µm, providing us with a high-resolution view into the internal structures and different layers within the tooth.
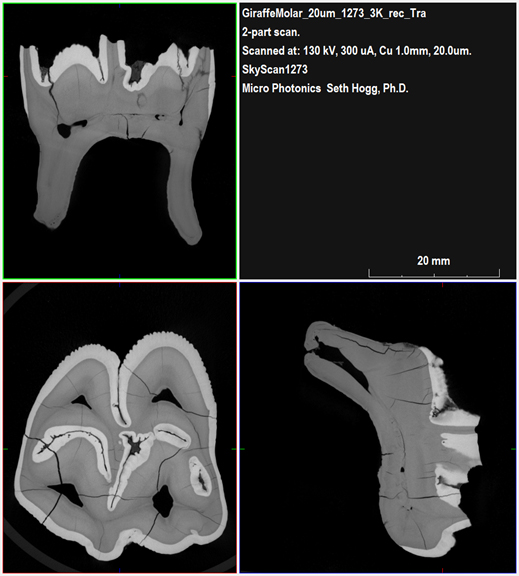
As shown from Bruker DataViewer in Figure 2, fine structural details and cracks are visible in the molar at the isotropic 20 µm voxel size used for this study. We clearly observe differences in local density between the enamel (brighter white signal) and the dentin (moderate gray signal). In looking at the border of the enamel, small serrations are present, which further assist the molar in shredding the fibrous plant material food source.
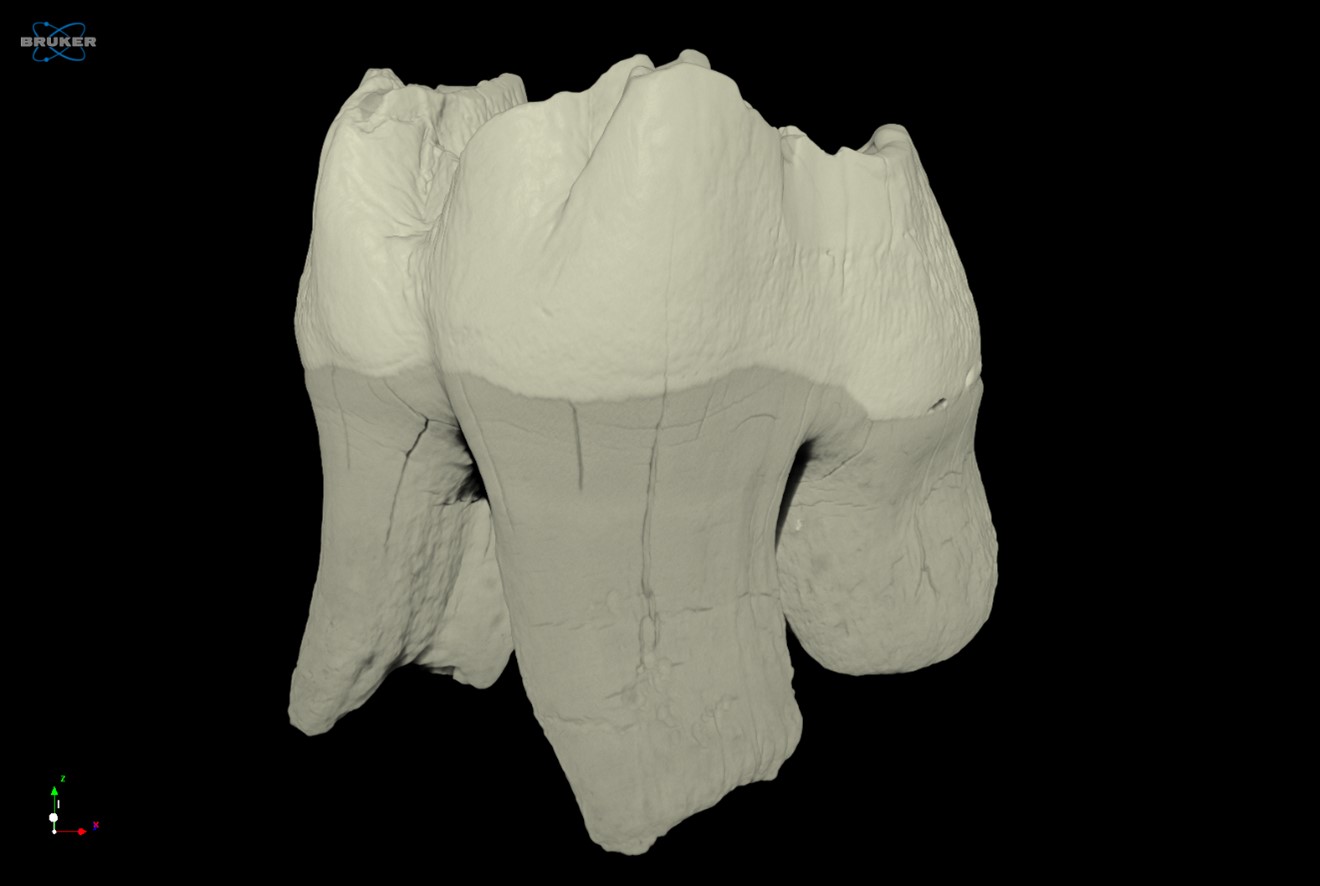
For this project, we utilized Bruker CTVox to render the volumetric data into an interactive 3D dataset and export custom videos exploring the tooth structures. Figure 3 provides one such view of the rendered volumetric dataset.
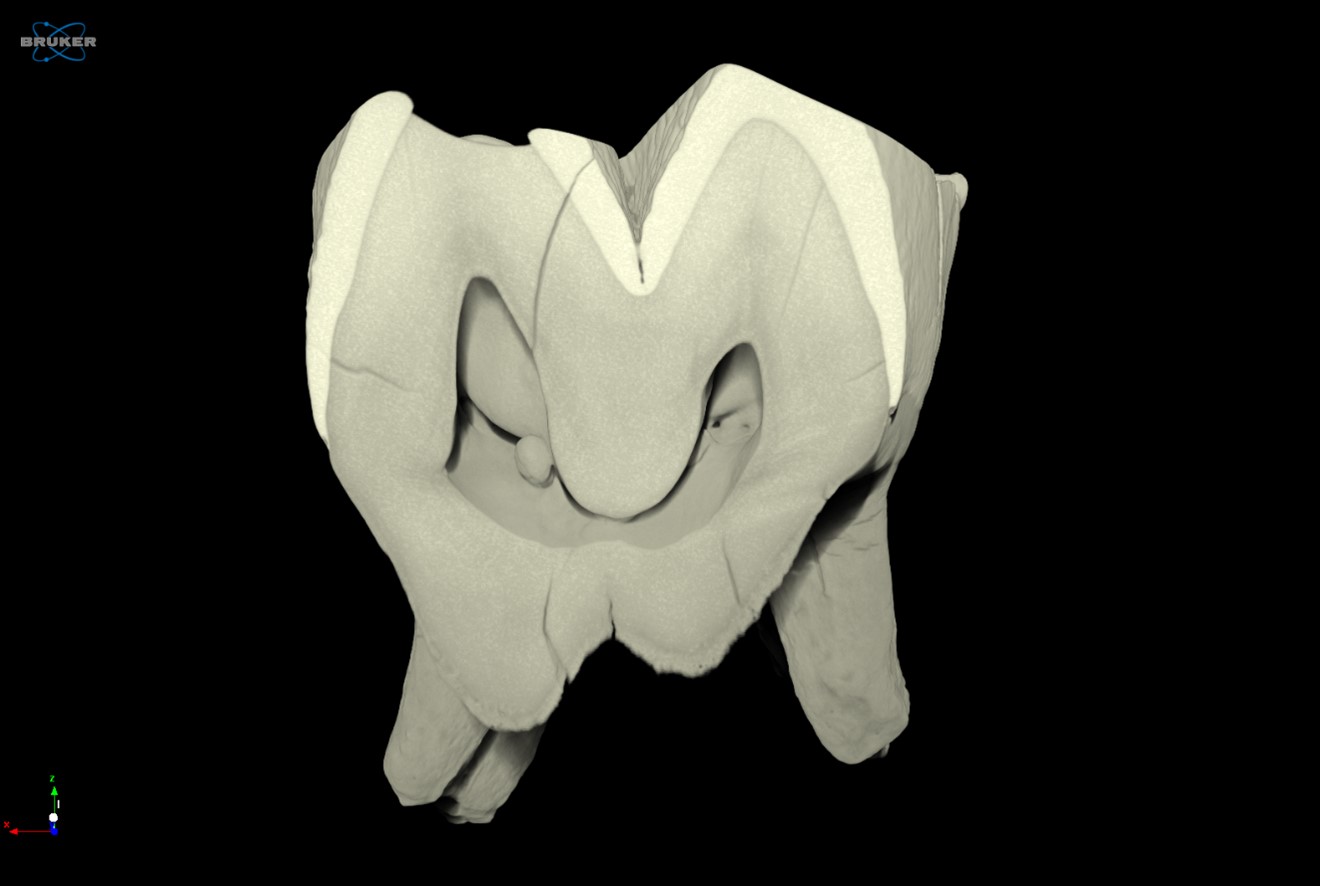
CTVox also allows us to control slice planes through the dataset, enabling us to visualize and study internal features within samples. Figure 4 highlights a clipped view along the center axis of the tooth, letting us qualitatively observe the relative thickness of the enamel along the profile of the tooth while also seeing the open root channels within the dentin. Fine cracks are also observed, though it is not clear if these are native to the tooth or were introduced during the extraction of the tooth from the giraffe skull and subsequent processing steps.

Figure 5 provides a photorealistic rendered image of the molar sample produced from the volumetric models created within Simpleware. By segmenting the enamel data and dentin data separately, we can apply different material properties to each volume to produce our final rendered images.
Conclusion
Micro-CT is a versatile technique which can image almost any sample type that both fits within the instrument and allows for X-ray energy to pass through without full attenuation. For many years, dental researchers have enjoyed the ability to capture extracted samples at high resolution for additional study or comparative analysis. After visualizing the molar structures in Bruker DataViewer and CTVox, we converted our image stack into a STL model suitable for downstream 3D printing and modelling using Simpleware by Synopsis.
We hope you find this Image of the Month article informative and encourage you to subscribe to our newsletter and social media channels in preparation for the continuation of our Image of the Month series next month.
Scan Specifications
| Sample | Giraffe Molar |
| Voltage (kV) | 130 |
| Current (µA) | 300 |
| Filter | 1.0 mm Copper |
| Voxel Size (µm) | 20 |
| Rotation Step (deg) | 0.2 |
| Exposure Time (ms) | 636 |
| Rotation Extent (deg.) | 360 |
| Scan Time (HH:MM:SS) | 07:23:34 |
These scans were completed on our Bruker SkyScan 1273 instrument at the Micro Photonics Imaging Laboratory in Allentown, PA. Reconstructions were completed using NRecon 2.0 while visualization and volumetric inspection of the 2D and 3D results were completed using DataViewer and CTVox. The giraffe molar dataset was converted to a STL volumetric model using Synopsys’ Simpleware software with the CAD add-on module (Synopsys, Inc., Mountain View, USA) before 3D rendering using Maverick Render Indie (Random Control, Madrid, Spain).
Would you like your work to be featured in our monthly newsletter? If so, please contact us by calling Seth Hogg at 610-366-7103 or emailing seth.hogg@microphotonics.com.
References
*Simpleware software (Synopsys, Inc., Mountain View, USA) enables you to comprehensively process 3D image data (MRI, CT, micro-CT, FIB-SEM…) and export models suitable for CAD, CAE and 3D printing. Use Simpleware software’s capabilities to visualize, analyze, and quantify your data, and to export models for design and simulation workflows. Simpleware™ is a trademark of Synopsys, Inc. in the U.S. and/or other countries.
- https://en.wikipedia.org/wiki/Giraffe