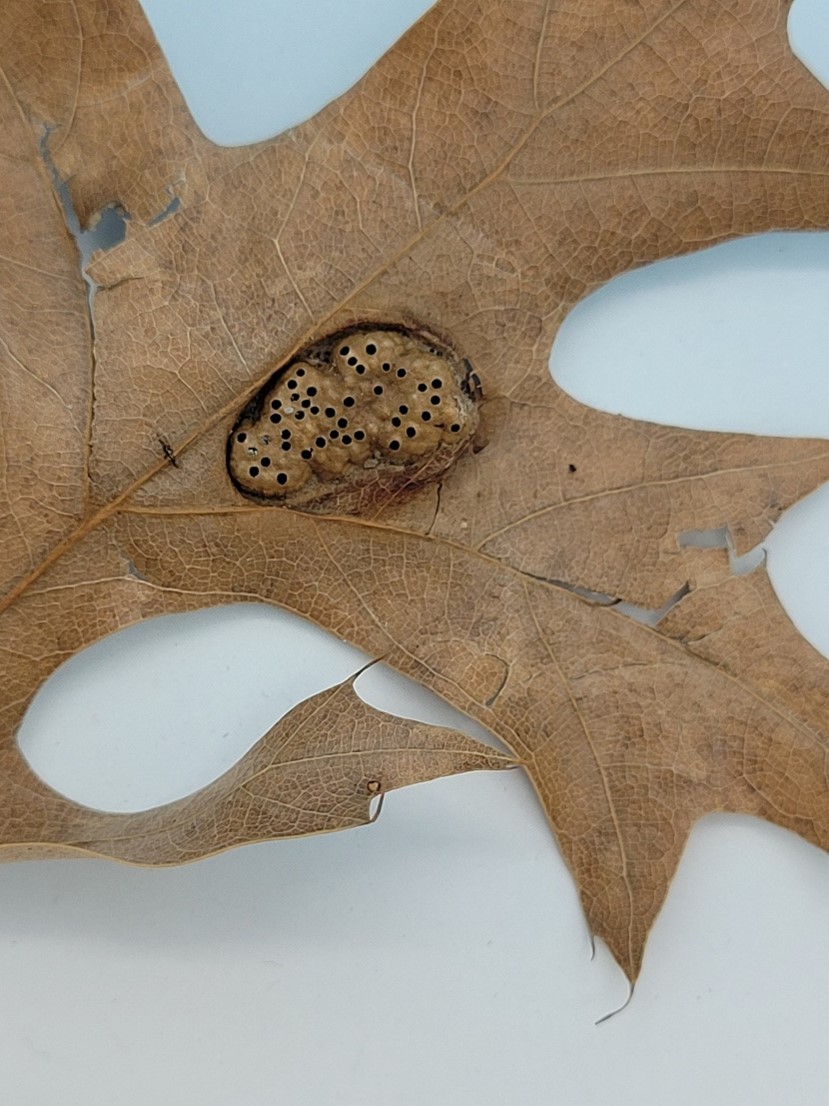
As part of their biodiverse role in our environment, oak trees provide respite to many different animals and insects. One type of insect group commonly found on oak trees are the gall makers, which cause abnormal growth on leaves, twigs, bark, buds, flowers, acorns, and even roots of the trees.1 Mostly caused by different tiny wasps within the Cynipidae family, some galls are formed by certain flies. After the insects interact with the oak, power stimuli are induced by the insect, causing the tree to create gall-producing hormones that create the protein rich gall to serve as a protective and nurturing environment for the developing larvae.
The form of ech gall depends on the insect species involved, resulting in the remarkable variety of galls seen on oak trees. In most cases, these structures do not seriously harm the tree, and oaks and gall-forming insects coexist without issue. Heavy infestations can stress weakened or diseased trees and may reduce canopy growth, but under normal conditions galls are considered a natural and fascinating part of the oak ecosystem.
X-Ray Microscopic Imaging – High Resolution Imaging of Plant Samples
Micro-CT is an ideal tool for botanical imaging, revealing fragile internal anatomy non-destructively and in high detail. For this study, the oak leaf gall dataset was acquired using our high-resolution SkyScan 1272 CMOS Edition at an isotropic voxel size of 5.2 µm, providing us with a high-resolution view into the fragile dried leaf structure along with the remaining insect larvae that failed to reach maturity. We first sectioned out a portion of the leaf surrounding the gall to reduce the overall size of the sample while preserving the main points of interest within. Reducing your sample diameter allows higher resolution imaging on any micro-CT instrument, so in cases where there’s no harm in physically modifying samples this is an effective method for improving your imaging datasets.
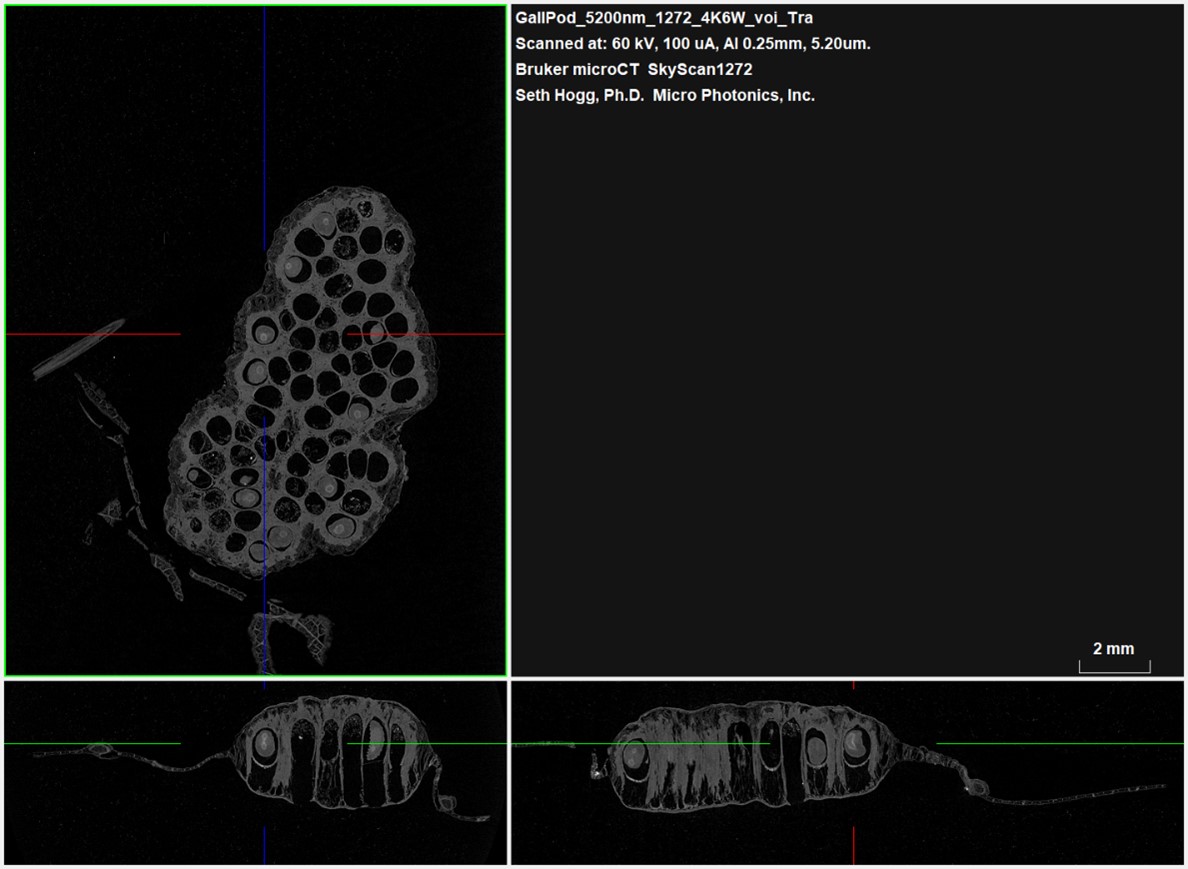
Figure 2: Planar 2D slices through an oak leaf gall
As shown from Bruker DataViewer in Figure 2, fine structural details and insect larvae are visible within the chambered compartments of this oak gall. We clearly observe differences in local density between the gall pod (brighter white signal) and the native leaf structures (moderate gray signal).
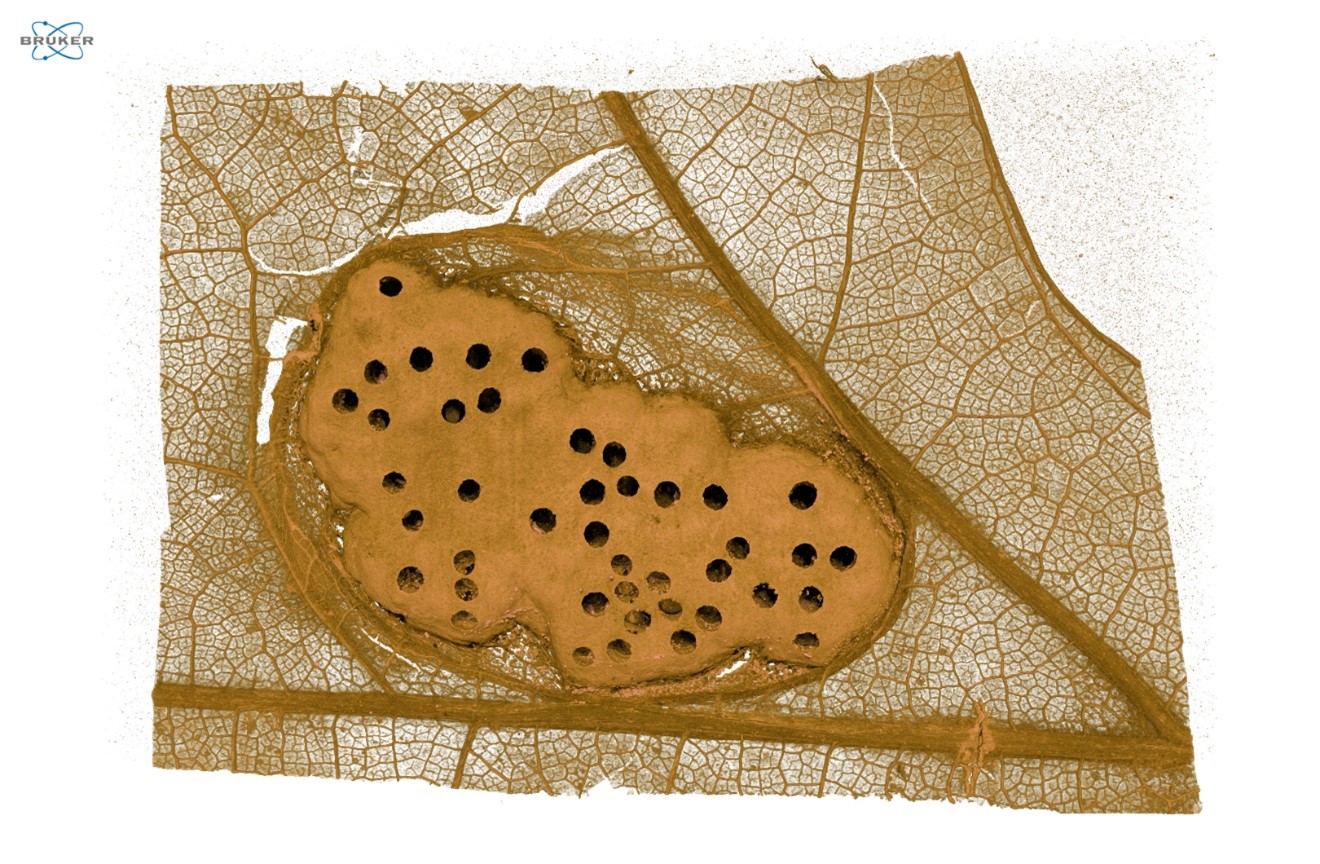
Figure 3: Rendered 3D high-resolution view of the gall and leaf structures
For this project, we utilized Bruker CTVox to render the volumetric data into an interactive dataset and export custom videos exploring the gall volume. Figure 3 provides a view from CTVox showing the remaining holes on the gall surface after the viable larvae departed the safety of the gall to begin their adult lives.
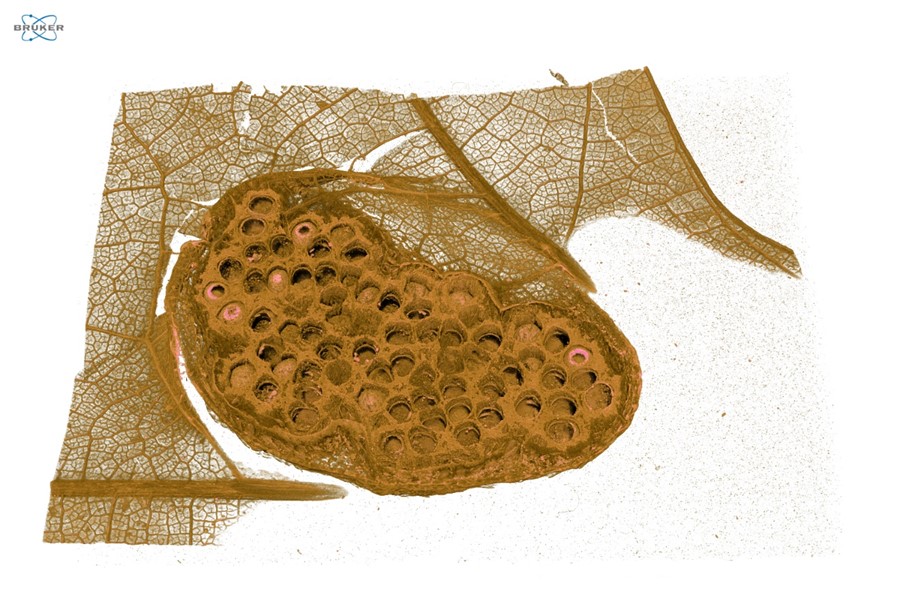
CTVox also allows us to control slice planes through the dataset, enabling us to visualize and study internal features within samples. Figure 4 highlights a clipped view along the center mass of the gall, letting us qualitatively observe both the empty gall chambers and the chambers that still contain larvae that did not reach maturity and leave the pod.
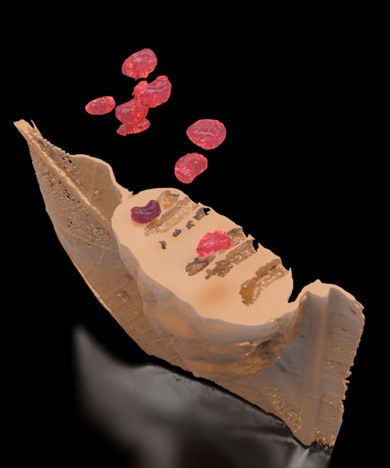
Figure 5 provides a rendered image of the gall dataset and the remaining larvae produced from the volumetric models created within Simpleware. While there is significant overlap in the attenuation data between the larvae and the gall, Simpleware allows for manual segmentation of structures like the insect larvae using a paint by threshold tool. This tool enables analysts to interactively define distinct regions of a dataset as unique masks by painting with a brush over a defined range of attenuation coefficients. Mask cleanup tools help remove unwanted segmented data, allowing portions of the sample to be separated that would not be distinguishable using standard thresholding methods alone.
Conclusion
Micro-CT is a versatile technique that can image almost any sample type that both fits within the instrument and allows for X-ray energy to pass through without full attenuation. While botanical structures are difficult to image due to their fragility, micro-CT provides a viable pathway for exploring these fine anatomical structures in great detail. After visualizing the gall structures in Bruker DataViewer and CTVox, we converted our image stack into STL models suitable for downstream 3D printing and modelling using Simpleware by Synopsis.
We hope you find this Image of the Month article informative and encourage you to subscribe to our newsletter and social media channels in preparation for the continuation of our Image of the Month series next month.
Scan Specifications
| Sample | Oak Gall |
| Voltage (kV) | 60 |
| Current (µA) | 100 |
| Filter | 0.25 mm Aluminum |
| Voxel Size (µm) | 5.2 |
| Rotation Step (deg) | 0.25 |
| Exposure Time (ms) | 1415 |
| Rotation Extent (deg.) | 360 |
| Scan Time (HH:MM:SS) | 04:04:52 |
These scans were completed on our Bruker SkyScan 1272 CMOS Edition instrument at the Micro Photonics Imaging Laboratory in Allentown, PA. Reconstructions were completed using NRecon 2.0 while visualization and volumetric inspection of the 2D and 3D results were completed using DataViewer and CTVox. The oak gall dataset was converted to a STL volumetric model using Synopsys’ Simpleware software with the CAD add-on module (Synopsys, Inc., Mountain View, USA) before 3D rendering using Maverick Render Indie (Random Control, Madrid, Spain).
Would you like your work to be featured in our monthly newsletter? If so, please contact us by calling Seth Hogg at 610-366-7103 or emailing seth.hogg@microphotonics.com.
References
*Simpleware software (Synopsys, Inc., Mountain View, USA) enables you to comprehensively process 3D image data (MRI, CT, micro-CT, FIB-SEM…) and export models suitable for CAD, CAE and 3D printing. Use Simpleware software’s capabilities to visualize, analyze, and quantify your data, and to export models for design and simulation workflows. Simpleware™ is a trademark of Synopsys, Inc. in the U.S. and/or other countries.
- https://www.canr.msu.edu/news/jumping_oak_gall_causing_damage_to_white_oak