
In both materials science and biological research projects, porosity is a highly important parameter in assessing samples. Most samples will contain both solid and void regions, and common applications studied include membranes and filtration media, pharmaceutical products and drug delivery systems, additively manufactured parts, and cortical and trabecular bone. The volumetric fraction of open space within each sample is known colloquially as the porosity and serves to parameterize differences in structure among samples. Samples with higher porosity generally show higher surface area to volume ratios; an increase in pore quantity/volume will lead to an increase in surface area within a given volume.
Pores can generally be categorized into two types, open and closed. Open pores are accessible to the outer surface of the sample and can either be distinct and located on the surface or may also be present throughout the sample, provided that other pores intersect to create an available pathway from the pore to the outer surface of the sample. Conversely, closed pores are completely inaccessible to the outside of the sample and are generally undesired for most applications. While they can have some use in lightweighting components by displacing solid mass with lighter gases, closed pores are typically limited in utility since they are not accessible.
For example, consider the concept of a kitchen sponge. The sponge is comprised of an organic material with a high percentage of open porosity. Upon the introduction of water to the sponge, water flows through the pore network via capillary action until the water wets all the pores and the sponge is considered saturated with water being held internally via surface tension.
Current Porosity Analysis Methods
Porosity calculation generally relies on one of several established analytical methods.
Mercury porosimetry submerges a sample into a container of liquid mercury and utilizes high pressures to force the mercury solution into the sample pores. High pressures are required as mercury has a high contact angle with most samples and thus does not naturally want to proceed into the pores. Pores between several nanometers to hundreds of micrometers can be calculated using this technique but samples must be physically robust enough to avoid deformation at pressures used for testing, which in some cases may reach as high as 60,000 PSI.1 Due to the strength requirements of this testing procedure, it pairs well with ceramics, metals, medical implants, and electronics. One additional limitation of this technique is the lack of data produced related to closed pores since they are inaccessible to the flow of mercury.
Brunauer-Emmett-Teller (BET) specific surface area testing typically utilizes nitrogen or argon gas to characterize surface area and porosity by calculating the amount of gas that both adsorbs and then desorbs from the sample undergoing testing within a controlled test environment. In preparation for testing, samples must be fully dried and then flushed with either vacuum or an inert gas to remove any surface contaminants. A measured amount of, most typically, nitrogen, is then introduced to the sample and allowed to adsorb onto the available surfaces within the sample, which is stored at cryogenic temperatures. After adsorption is saturated, the testing gas is fully desorbed from the sample and the Barrett-Joyner-Halenda (BJH) mathematical model is used to calculate the pore distribution of the sample.2,3 This measurement technique typically works best for pores in the single nanometer to hundreds of nanometer scale and does require samples that are fully dried. Much like mercury porosimetry, BET quantification is also unable to provide any details related to closed porosity in samples.
Scanning electron microscopy (SEM) provides another avenue for pore measurement and porosity quantification. In this technique, a dry sample is coated with a thin, conductive metal layer to prevent localized charge buildup on the surface of the material. The sample is placed within a vacuum chamber and a high energy electron beam is directed onto the surface. Most typically, signals from back-scattered electrons arising from the sample are measured and a live image of the sample is produced. From these images, porosity and pore sizes can be calculated. In addition to requiring the sample to be coated to dissipate charge and requiring the sample to be compatible with a high vacuum chamber, electron microscopy is also inherently a planar imaging tool as secondary electrons are only released from the surface of the sample leading to 2D images as an output. Thus, while SEM provides a high-resolution view of samples, it does not provide a way to inspect porosity throughout the entire volume of the sample or samples with a heterogeneous pore distribution that may be different in the bulk from the surface. Newer instruments couple focused ion-beam milling (FIB) with SEM and can actively ablate the surface of the sample to move down through the volume to capture 2D slice data at different depths. However, this is inherently a destructive technique and still assesses porosity on a 2D slice-by-slice basis. While FIB-SEM is among the highest resolution imaging methods for assessing very small pores, the sampled volume is quite small, only a few square micrometers at a time.
Confocal laser scanning microscopy (CLSM) is built upon traditional optimal microscopy techniques but employs the use of a laser to illuminate the sample, coupled with detecting fluorescence from within the sample. For many years, this technique provided great utility in biological research with the ability to use specific binding fluorescent markers that preferentially bind to targeted regions with samples. More recently, researchers utilized CLSM for assessing pore volume and porosity in geological and other materials science samples through impregnation of the sample with a low-density epoxy filled with a fluorochrome. Since CLSM is only reading out the fluorescent signal from the sample, the pores themselves are directly mapped because the fluorescently labeled epoxy preferentially fills the voids within the sample. 4Much like FIB-SEM, CLSM rasters the sample and, using the very precise depth of field afforded through the technique, produces a thin image slice in 2D. This image slice can be accumulated through 3D space to produce a 3D dataset without the need for physical ablation of the surface. This process is possible for only the volume of the sample where the incident laser energy can penetrate and the pinhole detector setup provides a tightly controlled view into the sample, achieving resolutions that bridge the gap between FIB-SEM and micro-CT imaging.
Micro-CT imaging relies on the differential attenuation of X-ray energy through a sample to produce datasets. In ex-vivo micro-CT imaging, samples are illuminated with a micro or nano-focused polychromatic X-ray source and hundreds to thousands of 2D transmission views through the sample are collected via the high-resolution detector at various rotational angles through the sample. The 2D image stack is fed through a reconstruction algorithm to compute the most likely 3D volumetric dataset. From the volumetric dataset produced, the images are binarized and the porosity and pore size distribution are obtained either from a slice-by-slice 2D prospective, like other techniques listed here, or from a full 3D volumetric assessment. Traditional micro-CT imaging typically can resolve features on the order of single micrometers in scale while newer nano-CT imaging systems push resolution further into submicron regimes. One limitation of micro-CT imaging is the need to have X-ray transmission through the sample, so the selection of the X-ray energy used must be compatible with the density of the material under study. For larger, denser samples the X-ray energy must be correspondingly increased to maintain transmission through the sample, which usually results in reductions to imaging resolution from the increased emission spot size needed to provide the necessary X-ray flux. While micro-CT imaging is possible on both hydrated and dry samples, organic samples that contain liquids within their pores may not provide enough differential attenuation of the signal between the organic matrix and the liquid filled pores and would produce a dataset without sufficient contrast between the pores and the matrix for analysis. However, in most cases with air filled pores or pores filled with a lower density component than the sample matrix, porosity is a quick and straightforward analysis from micro-CT data. Micro-CT excels as a high-resolution technique that can provide pore data both from a 2D or 3D perspective with little to no sample preparation required. The remainder of this document will cover a specific example highlighting these capabilities.
Micro-CT Quantification of Porosity
One industry with rapid growth in the last decade where porosity is highly important is additive manufacturing. As additive manufacturing, or 3D printing, has grown in capability and utilization, the assessment of porosity in parts arising from this production technology remains a critical value in understanding part quality.
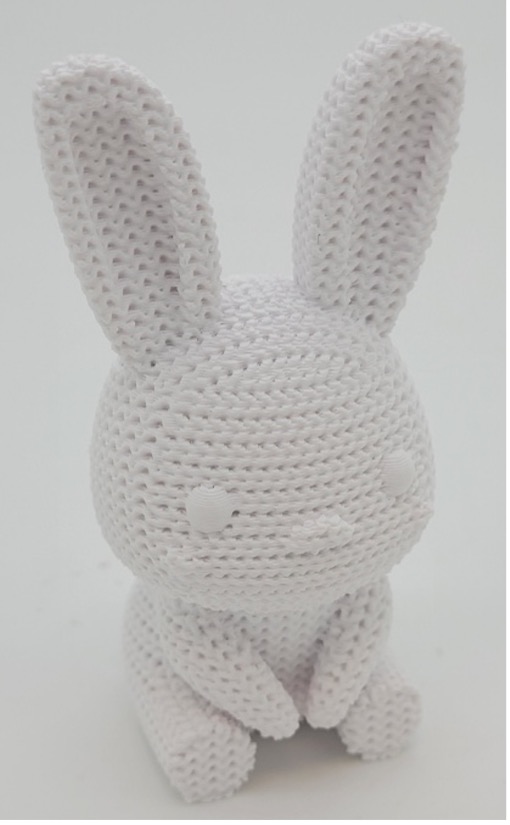
For this example, we examined an additively manufactured rabbit model produced with a fused deposition modeling printer. This type of printer creates final products through the controlled extrusion of a polymer filament depositing layers in 2D sections across the full height of the product to produce a 3D structure. In programming the printer to produce the rabbit model used for this study, we specified a region of low porosity near the base of the model where instead of a small portion of the internal volume being filled with plastic we requested the printer to significantly reduce the pore space by increasing the plastic volume deposited.
We mounted the printed rabbit model into a small plastic container and imaged it using our SkyScan 1273 desktop micro-CT at an isotropic voxel size of 25 µm. For traditional step-and-shoot imaging, we connected three acquisitions along the length of the sample to form a unified dataset with an imaging time of about two hours. We also repeated the imaging process at the same voxel size using the continuous imaging mode within the SkyScan 1273, which reduced the imaging time by about 80% down to about twenty minutes to cover the three scans along the length with a nominal tradeoff in imaging quality.
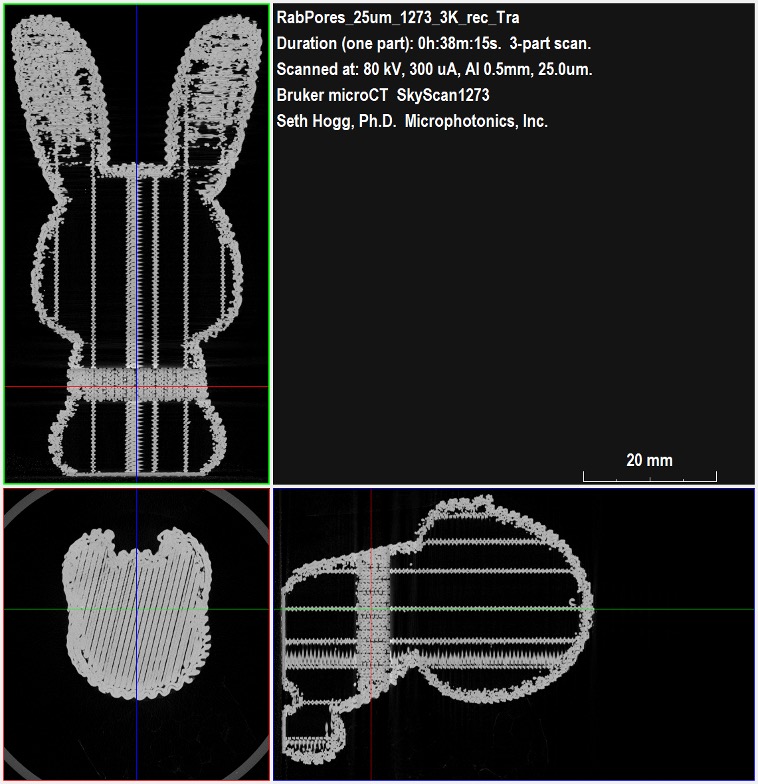
As shown from Bruker DataViewer in Figure 2, the SkyScan 1273 provided a detailed view throughout the entire print volume with the plastic portions shown in bright gray and the open pore space filled with air rendered as black. We can also see the region of reduced porosity we programmed into the print protocol as highlighted in this figure.
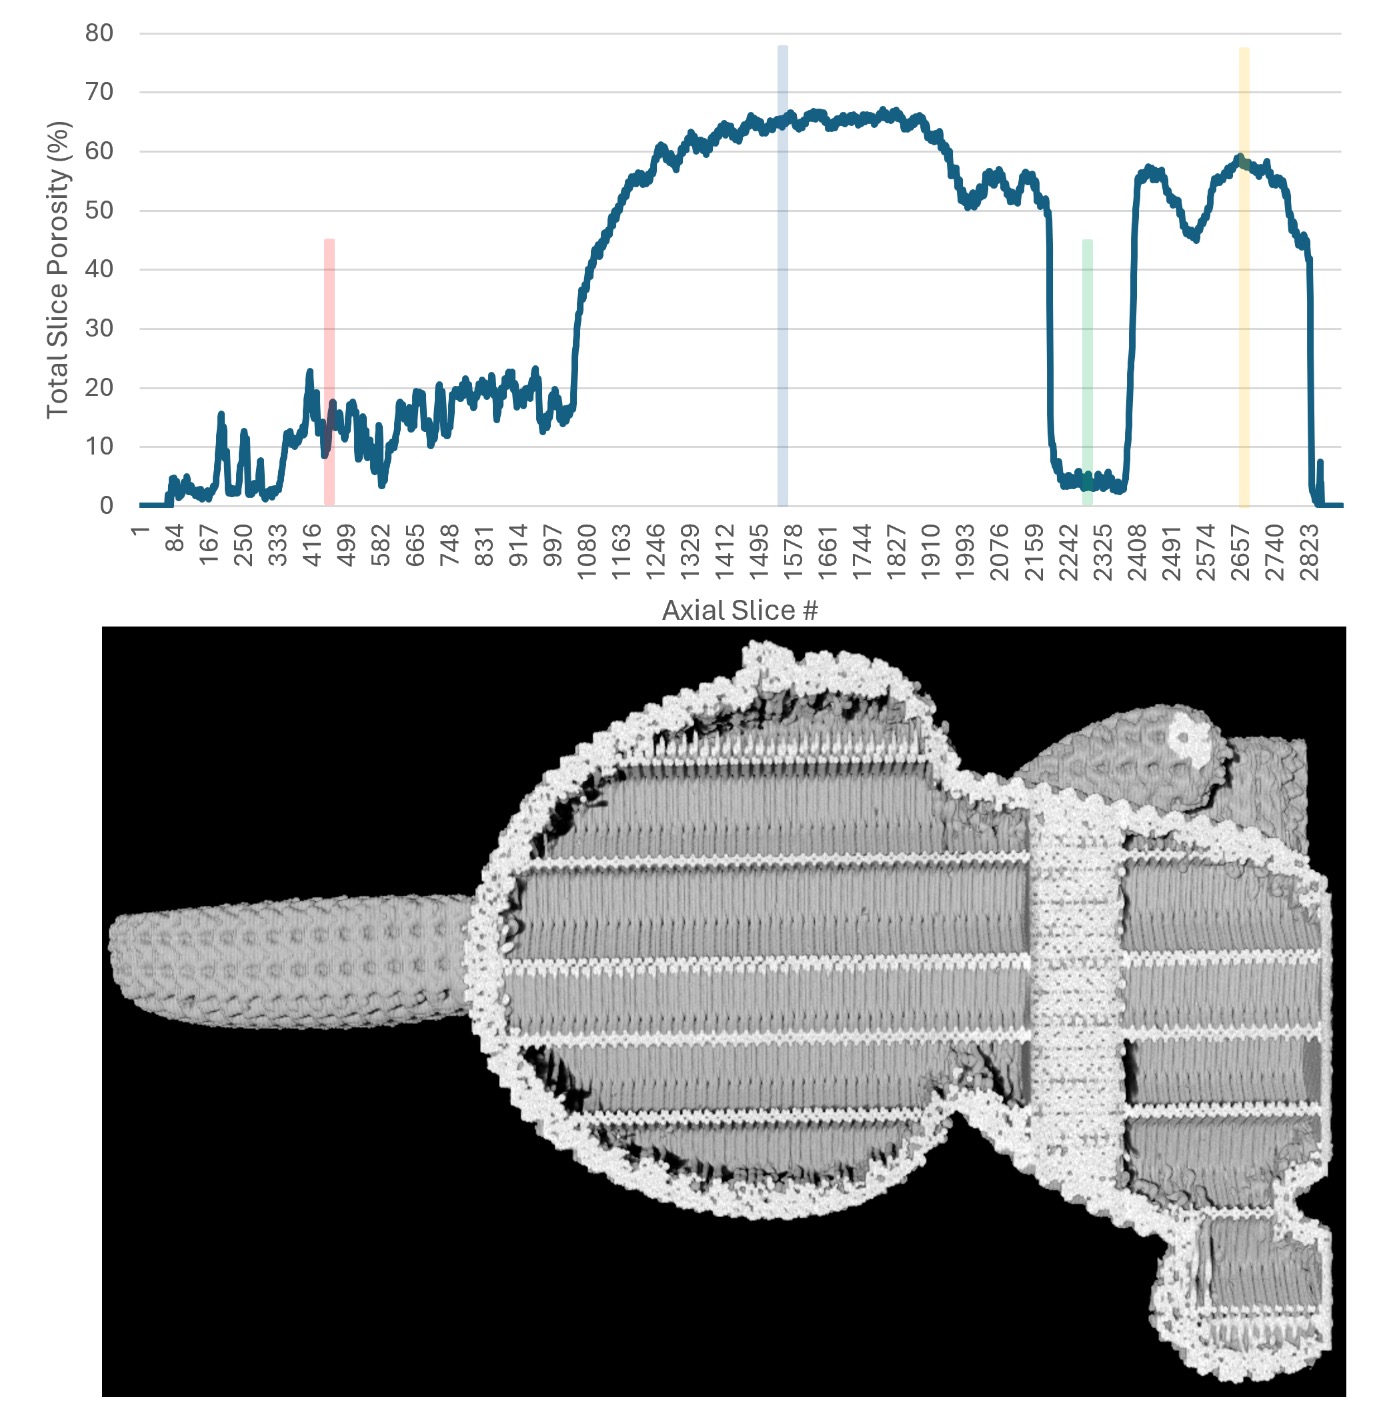
While the datasets produced by micro-CT imaging are three-dimensional, they can also be analyzed in a two-dimensional slice-by-slice basis where each slice represents another step of 25 micrometers through the sample, as in this specific case. We calculated the total porosity for each slice of the dataset from top to bottom and the results are presented in Figure 3. When comparing the results in the line graph to a clipped view through the dataset, we observe about 20% porosity through the ears, >60% porosity through the body, a drop of <10% porosity in our region of high infill, and then a corresponding increase back to ~60% porosity at the base of the model.
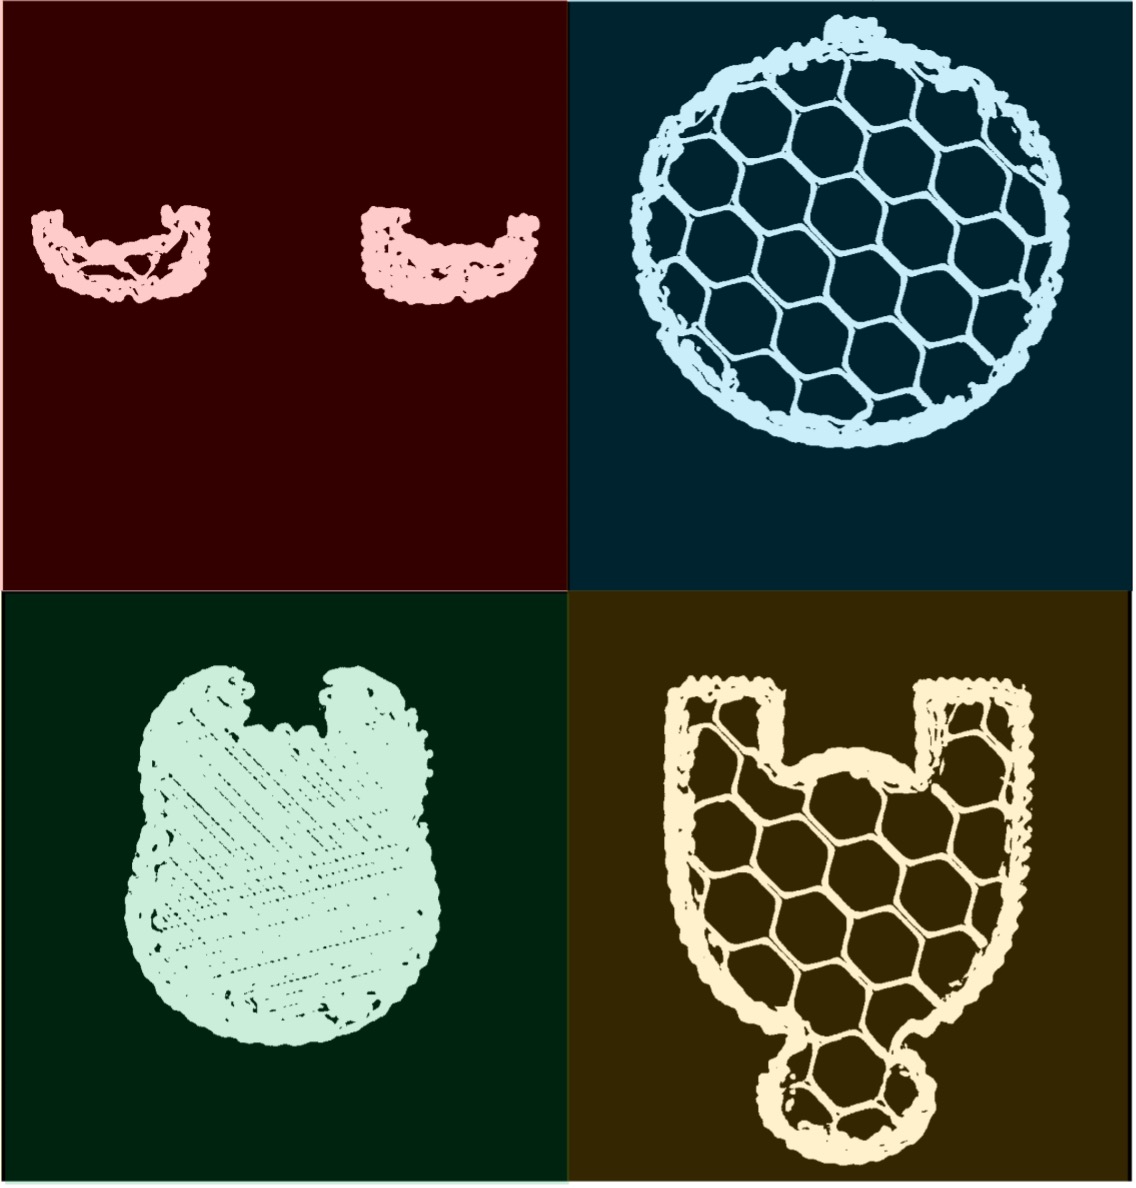
To delve deeper into the basis for the results shown in Figure 3, Figure 4 provides representative 2D slices obtained from the dataset at select points along our line graph. The ear section is shown in red with small distributions of porosity in the model while the head and body (blue and yellow respectively) have relatively high fractions of air space to plastic. Finally, our region of high infill, shown in green, highlights the relatively small amount of porosity that primarily is arising from incomplete overlap among the deposited plastic strings.
While 2D analysis clarifies trends that occur based on the orientation of the sample, micro-CT imaging also allows for a 3D analysis of porosity using a sphere fitting model to grow spheres in open space until they reach the walls. We calculated the total porosity volumetrically for the entire dataset and the results are presented in Figure 5. Overall, the analysis of this sample found an average of 49% porosity with 48% being open porosity and 1% being closed porosity. Unlike other techniques to quantify porosity, micro-CT can quantify closed porosity in addition to open porosity and is able to provide detailed information related to each type and their relative proportions to one another.
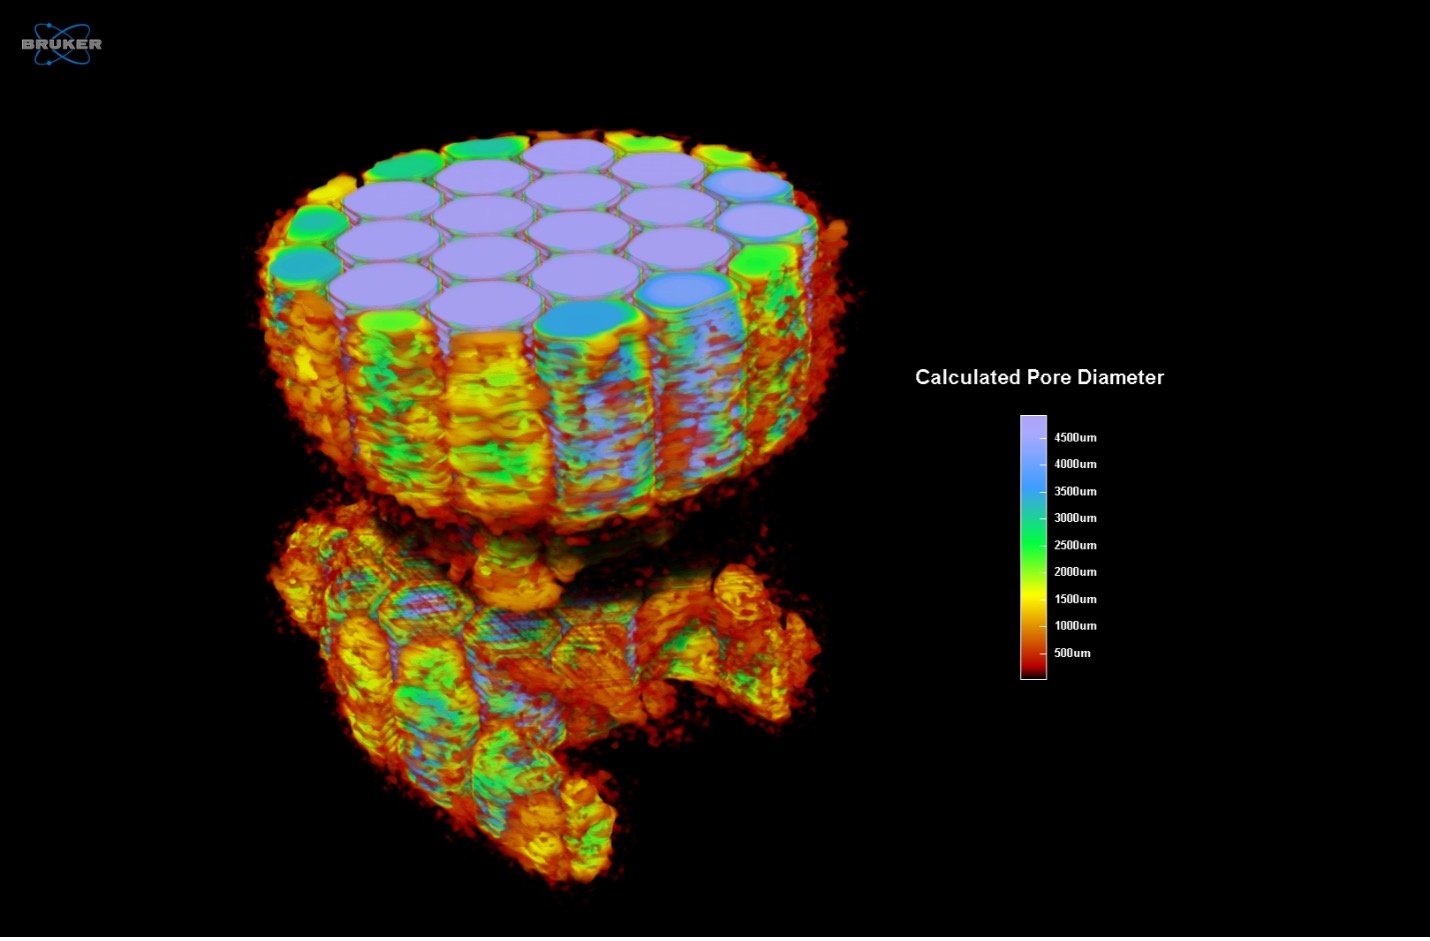
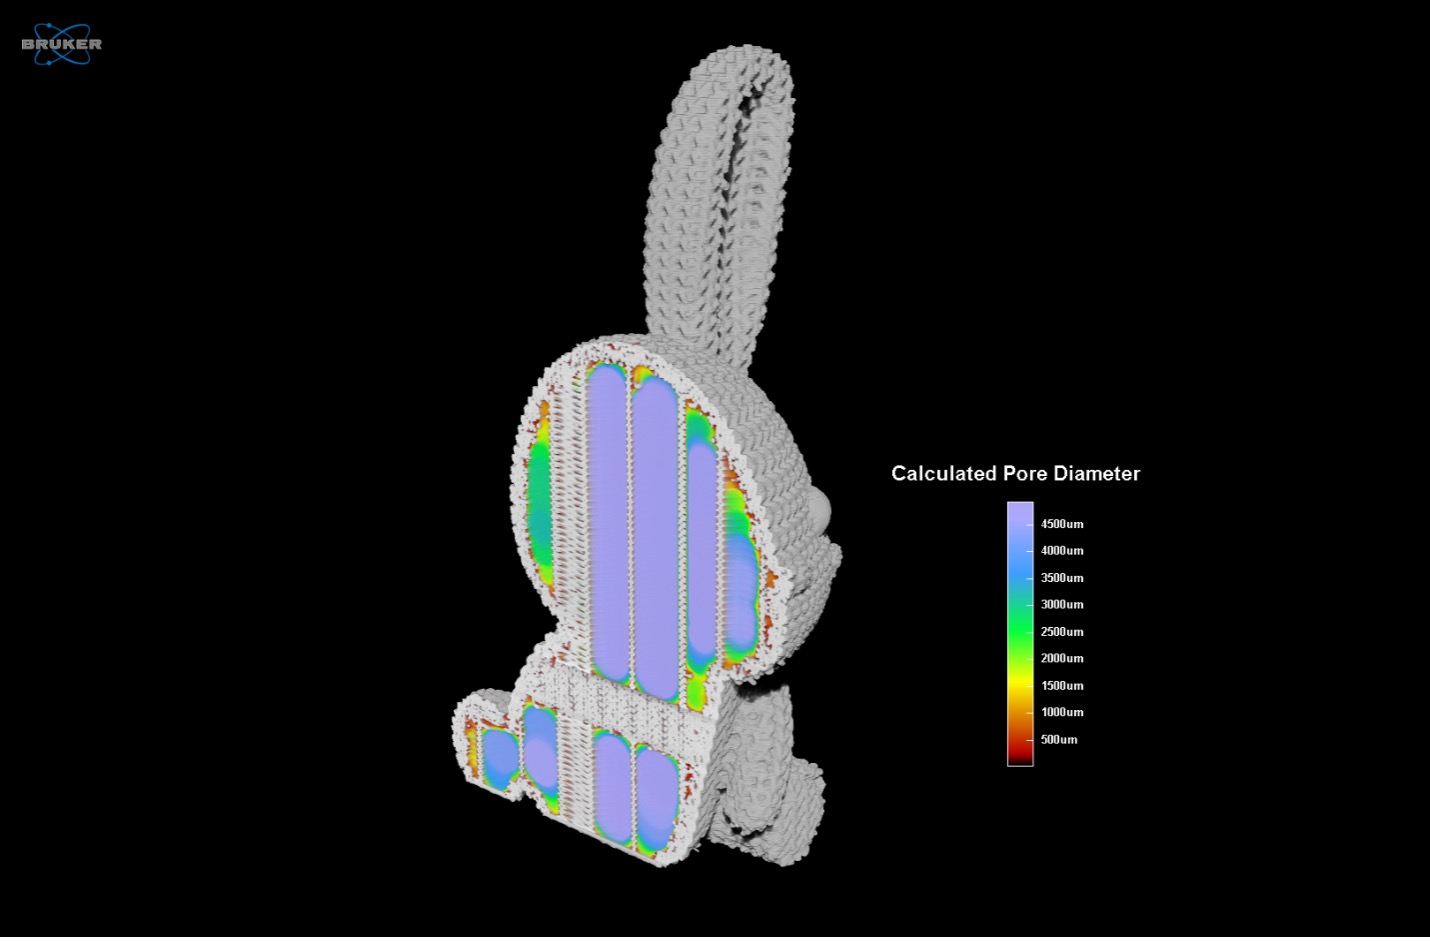
Figure 6 provides another view of the quantitative output from the analysis of the rabbit sample where only the pore data is shown while the model of the plastic is removed. The pore size data, colorized by increasing diameter, is also fully interactive, allowing researchers to digitally slice through the results and reorient the sample for different views that can help with interpretation of results by having a visual basis to compare against the raw numerical output. From the quantitative 3D analysis, we determined an average pore diameter of 3.5 ± 1.6 mm.
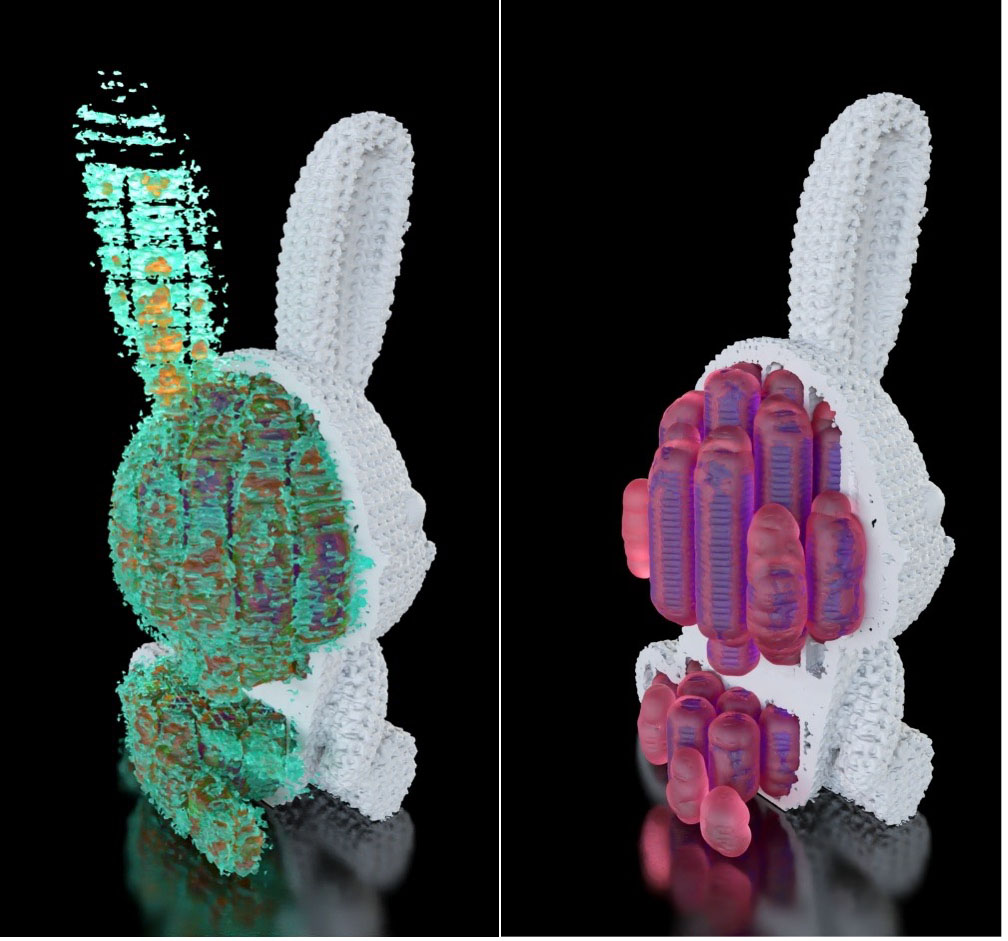
Figure 7: Externally 3D rendered models of dataset and pores highlighting all pores (left) and only the largest pores (right)
The rabbit dataset along with the calculated pore models were imported into Simpleware ScanIP software with the CAD add-on module to segment into a meshed model of the rabbit along with individual models for different sized pores. Maverick Render Indie then allowed us to apply colors and textures to the models, as shown in Figure 7. From much the same view as shown in Figure 5, we view the location and relative size of the pores as they are distributed through the dataset. Since we broke down the overall distribution of pores into some representative size bins, a model is possible for each size group. In viewing the data, the different sized pores can be switched on or off, allowing us to view only the pore size of interest at any given time.
Conclusion
While porosity of samples can be quantified via numerous available analytical techniques, all with their own positive and negative features, micro-CT uniquely stands alone as a non-destructive analysis method that captures the full volume of the sample as a 3D dataset. From these datasets, the quantification of porosity is typically straightforward and, in addition to numerical results, researchers also obtain interactive visual representations of the pore data. While knowing the overall porosity of a sample is key, knowing the localized position of pores within the sample often provides additional probative value.
We hope you find this Image of the Month informative and encourage you to subscribe to our newsletter and social media channels in preparation for the continuation of our Image of the Month series next month.
Scan Specifications
| Sample | Rabbit – Standard | Rabbit – Continuous |
| Voltage (kV) | 80 | 80 |
| Current (µA) | 300 | 300 |
| Filter | 0.5 mm aluminum | 0.5 mm aluminum |
| Voxel Size (µm) | 25 | 25 |
| Rotation Step | 0.3 | continuous |
| Exposure Time (ms) | 294 | 294 |
| Rotation Extent (deg.) | 360 | 360 |
| Scan Time (HH:MM:SS) | 01:54:45 | 00:21:09 |
These scans were completed on the SkyScan 1273 micro-CT system at the Micro Photonics Imaging Laboratory in Allentown, PA. Reconstructions were completed using NRecon 2.0 while visualization and volumetric inspection of the 2D and 3D results were completed using DataViewer and CTVox. The printed model and pore data were converted to a STL volumetric models using Synopsys’ Simpleware ScanIP software with the CAD add-on module (Synopsys, Inc., Mountain View, USA) before 3D rendering using Maverick Render Indie (Random Control, Madrid, Spain).
Would you like your work to be featured in our monthly newsletter? If so, please contact us by calling Seth Hogg at 610-366-7103 or emailing seth.hogg@microphotonics.com.
References
*Simpleware software (Synopsys, Inc., Mountain View, USA) enables you to comprehensively process 3D image data (MRI, CT, micro-CT, FIB-SEM…) and export models suitable for CAD, CAE and 3D printing. Use Simpleware software’s capabilities to visualize, analyze, and quantify your data, and to export models for design and simulation workflows. Simpleware™ is a trademark of Synopsys, Inc. in the U.S. and/or other countries.
Rabbit model sourced from Bambu Labs Makerworld created by artist Smoggy3D:
https://makerworld.com/en/models/992786-knitted-easter-bunny-rabbit#profileId-968615
