
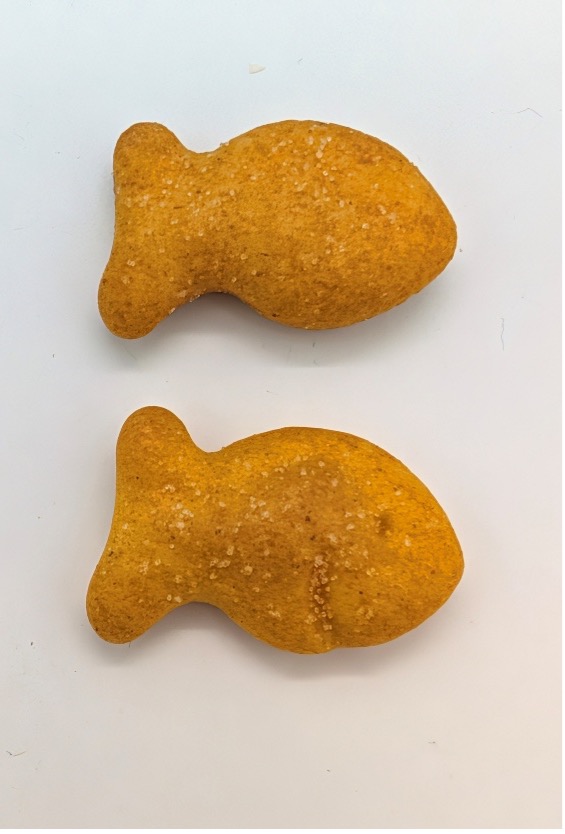
Consumers and public health guidance increasingly favor whole grains, supported by analytic evidence that higher intake is associated with lower risk of coronary heart disease, cardiovascular disease, total cancer, and all-cause mortality (Aune et al., 2016). The food industry has responded by reformulating breads, cereals, snacks, and pastas to include more whole grain (Doblado-Maldonado et al., 2012). However, substituting whole grain ingredients is rarely a simple one-for-one swap. The bran and germ fractions that supply these benefits also alter dough behavior: bran competes with gluten for water, and its hydration properties reduce dough strain hardening and gas retention, which lowers loaf volume even after water absorption and mixing time are optimized (Packkia-Doss et al., 2019; Van Craeyveld et al., 2020). Bran particle size adds further variability, affecting water absorption, dough stability, and gluten index (Amr & Saleh, 2023). Whole grain flours also have a shorter shelf life than refined flours because of their lipid content and lipid-degrading enzymes, chiefly lipase in the bran and lipoxygenase in the germ, which drive rancidity (Doblado-Maldonado et al., 2012). Food scientists must therefore evaluate ingredient and process changes carefully, using systematic research to anticipate how formulation, particle size, mixing conditions, or baking parameters will affect the final product. Only through this kind of deliberate investigation can manufacturers deliver whole grain products that are both nutritionally superior and acceptable to consumers.
This month we demonstrated the high throughput capabilities of the Bruker X4 Poseidon desktop micro-CT with the attached carousel accessory for food processing research and development.
Within the Micro Photonics Imaging Laboratory, we are excited to see the high interest our X4 Poseidon which marries a high-resolution transmission X-ray source capable of an emission spot size down to 2 µm with both a high-resolution sCMOS and a high-speed flat panel detector combined using the MultiVision configuration.
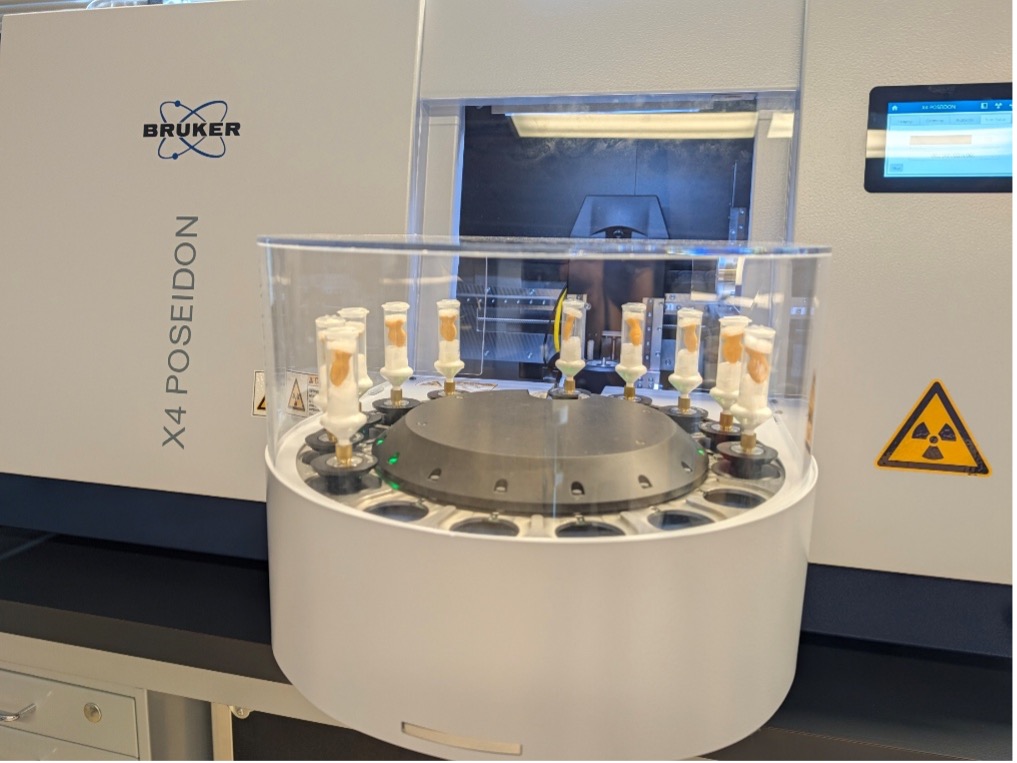
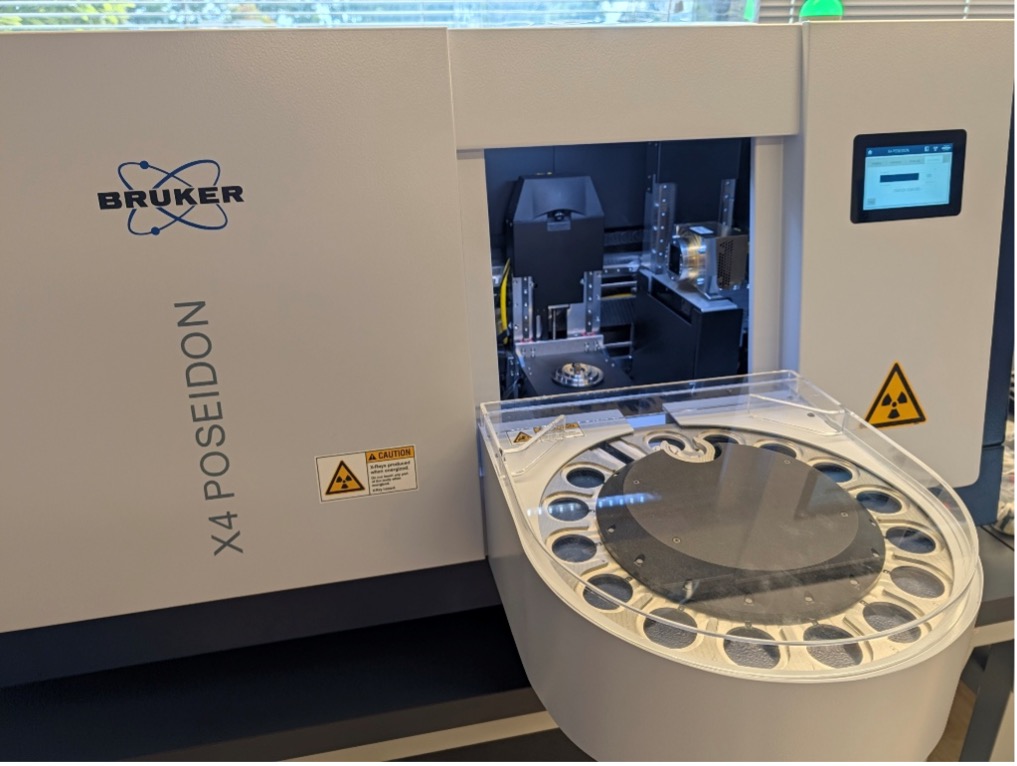
Compared to both the SkyScan 1272 and SkyScan 1275 instruments replaced by the X4 Poseidon, the new instrument brings significant improvements to the speed and reliability of the carousel accessory while reducing the complexity of setup and tear-down. For both past SkyScan systems, use of the carousel was an all or nothing approach with samples only being able to be inserted into the instrument using the carousel once installed. This led to downtime in laboratories as the carousel needed to be installed and removed on a week-to-week basis depending on the imaging needs of that week. The Bruker X4 Poseidon carousel is designed to remain attached to the instrument whether it is in use or not as it now mounts in front of the instrument rather than atop it as detailed in Figure 2.
High Throughput X-Ray Microscopic Imaging – X4 Poseidon – Carousel Accessory
To complete this quantitative assessment of differences between the two cracker formulations, we employed the high-speed flat panel detector to image five crackers from each formulation using the carousel accessory for unattended batch imaging. The flat-panel detector quickly captured the fine structural details of each cracker at an isotropic voxel size of 15 µm.
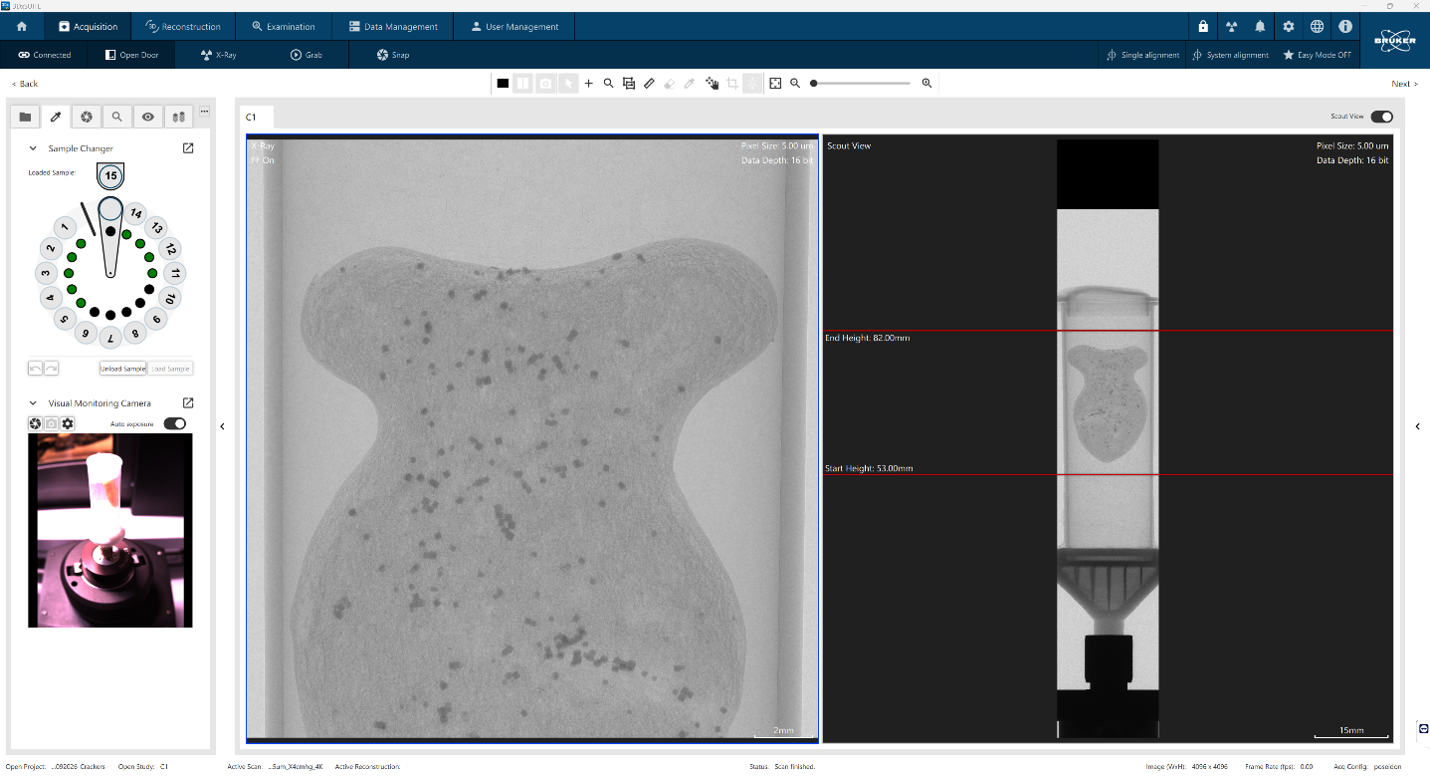
As shown in Figure 3, compared to past SkyScan instruments, the new Bruker X4 Poseidon utilizes an entirely new control software suite called 3D Suite. Within this program, users are provided with a vast amount of flexibility in setting up their samples to best meet the imaging needs for each project. This view highlights the ability to monitor the carousel status, the live view through the micro-CT, and the ability to define imaging parameters for tall (oversize) imaging modes from
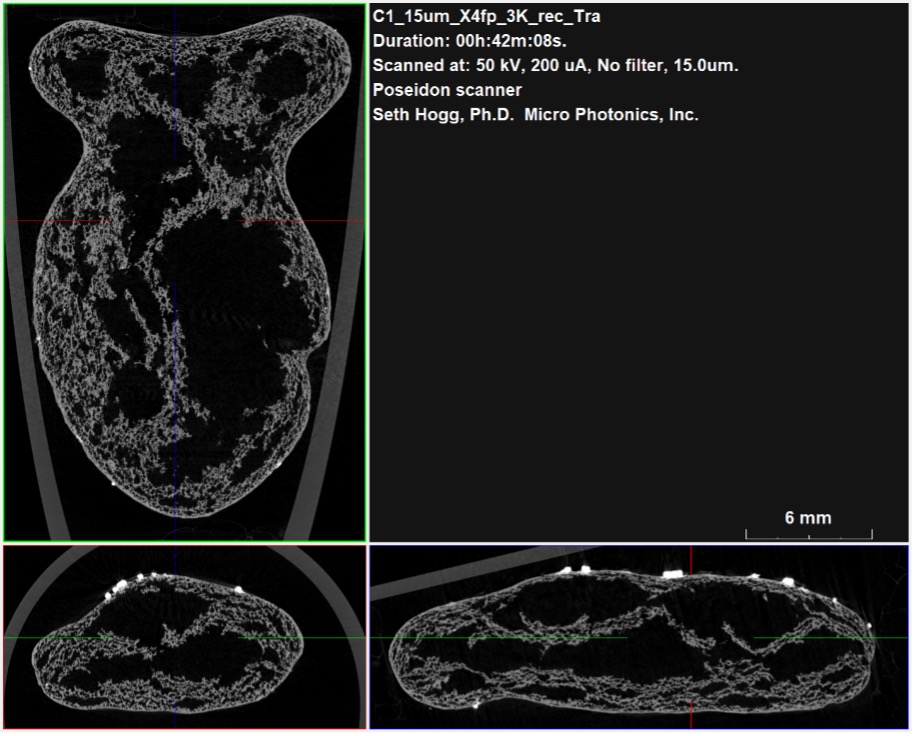
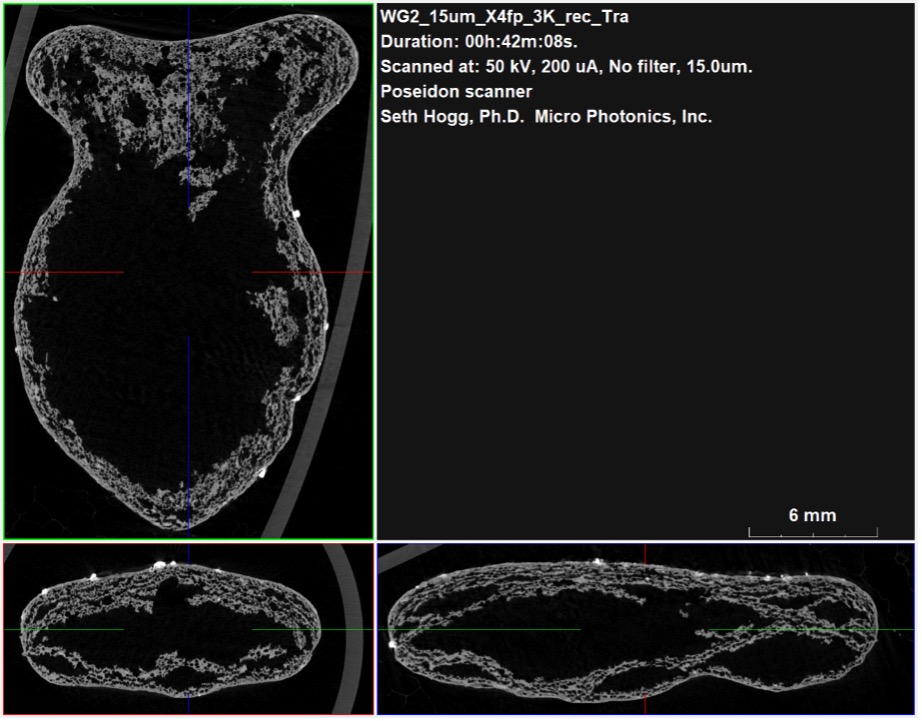
As shown in Figure 4, both cracker formulations have large pores focused in the center of the volume with thinner structures radiating in from the outer surface. Bright spots are visible in the image arising from the presence of salt crystals primarily deposited on the top surface of each cracker. In micro-CT imaging, the relative brightness of any pixel in a dataset is determined by the X-ray attenuation of that feature during imaging. Sodium chloride particles show up brighter in the reconstructed datasets as they attenuate a higher fraction of the incident X-ray energy compared to the primarily organic components present in the cracker dough base.
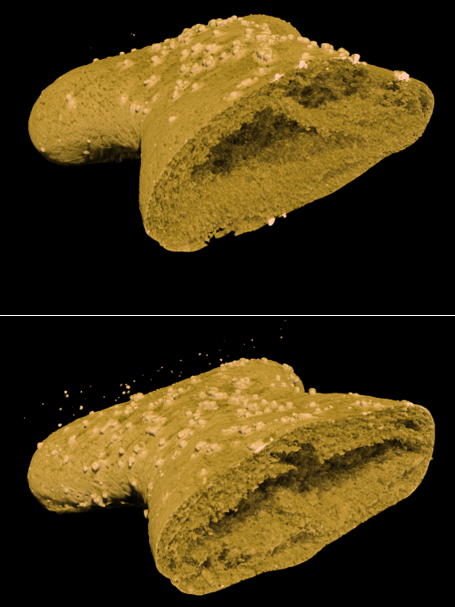
For this project, we utilized Bruker CTVox to render the volumetric data into an interactive dataset further explore fine cracker structures and the distribution of pore volume. Figure 5 provides a clipped view from within CTVox comparing the traditional formulation against the whole wheat formulation further supporting our observations from DataViewer of a high degree of similarity between the formulations. As a product development scientist, understanding differences arising from formulation changes is a key function of their role. Micro-CT directly compares formulations on a microscopic level aiding in this research process.
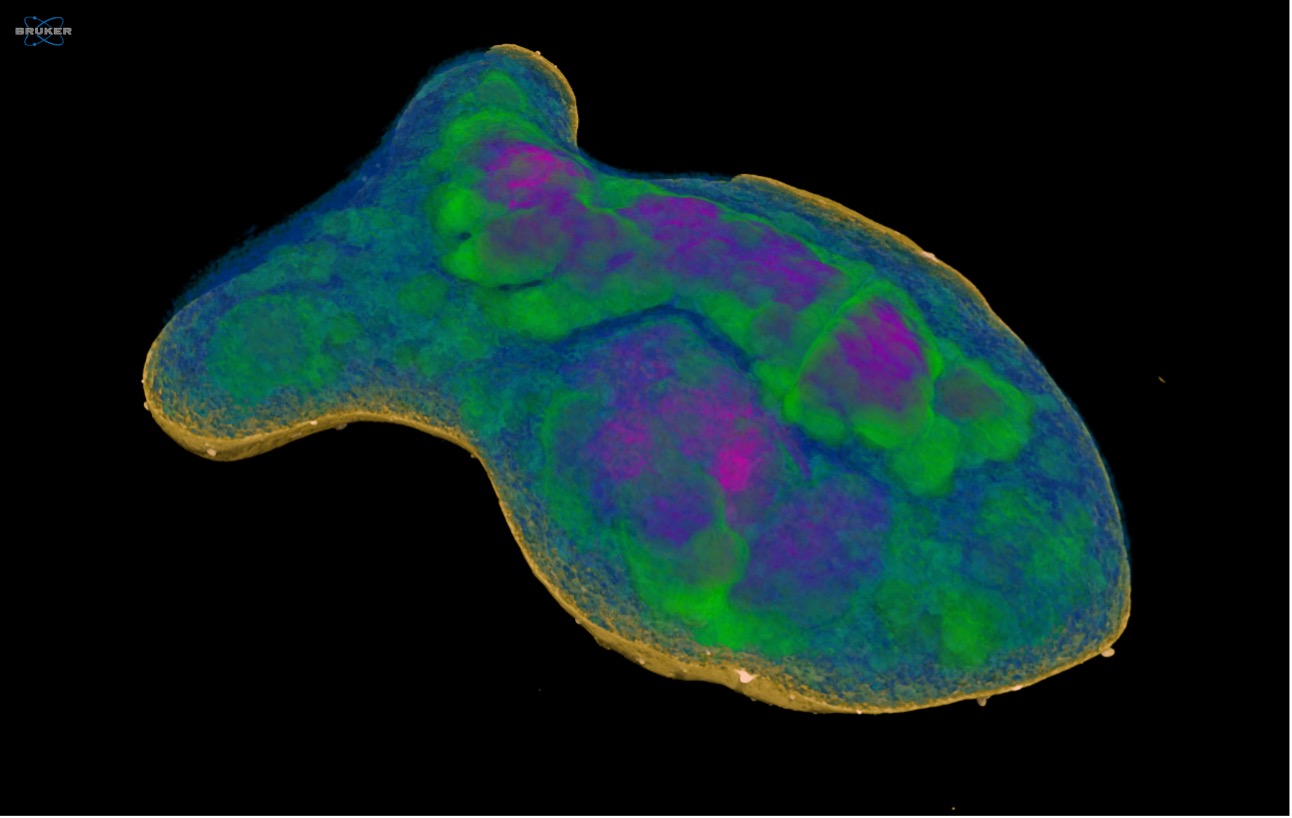
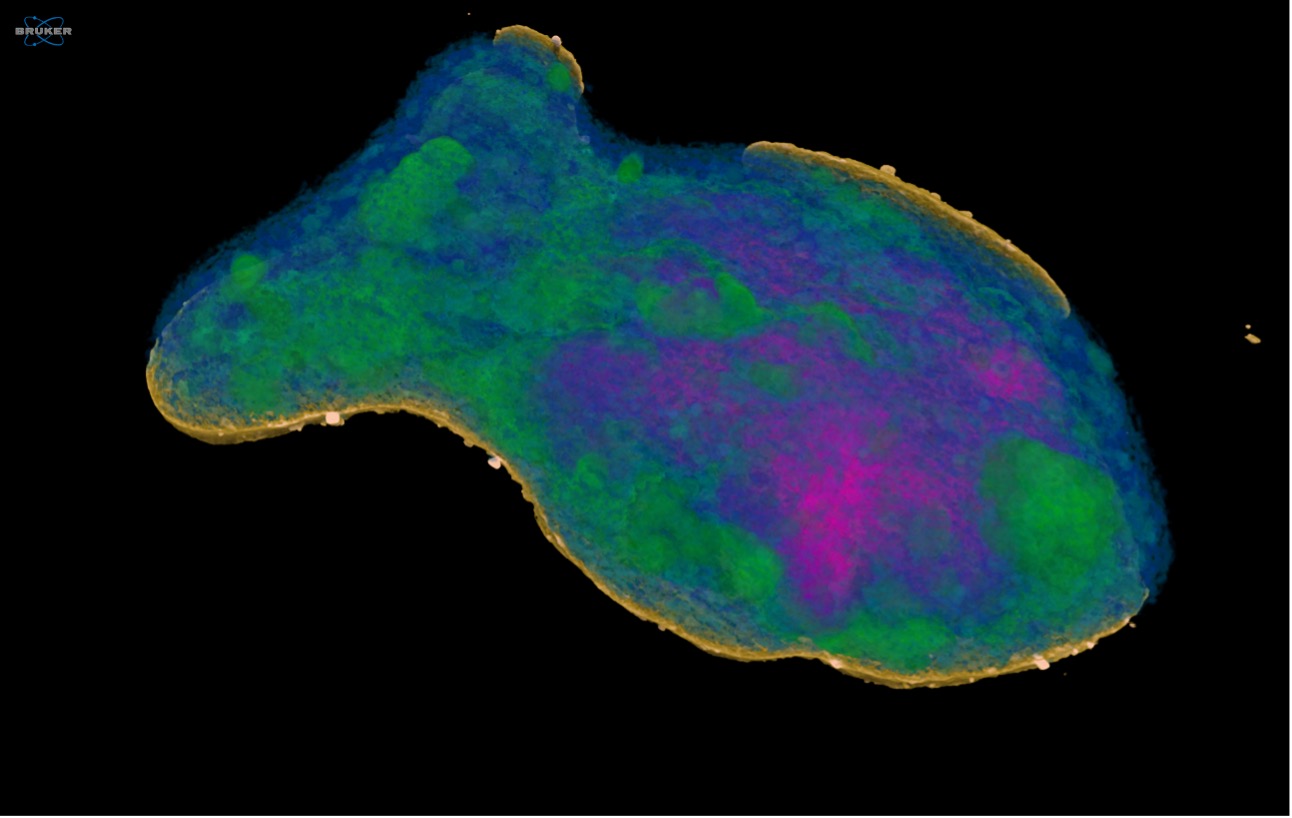
CTVox allows us to overlay the quantitative pore data obtained from CTAn to visualize and map the location of pores in 3D space and apply color coding based on their calculated diameter. Figure 6 highlights a clipped view along the midplane of the two cracker formulations with the quantitative pore data overlaid and colored based on calculated diameter. For the five traditional formulation crackers examined, we used Bruker CTAnalyzer to calculate a global porosity of about 74% and an average pore diameter of 1.02 ± 1.08 mm. In comparison, the whole grain formulation was found to have a porosity of about 72% and an average pore diameter of 1.13 ± 1.14 mm. As these values both fall within the deviation of each measurement, we can conclude the two formulations are nominally similar when assessed on pore size and total porosity.
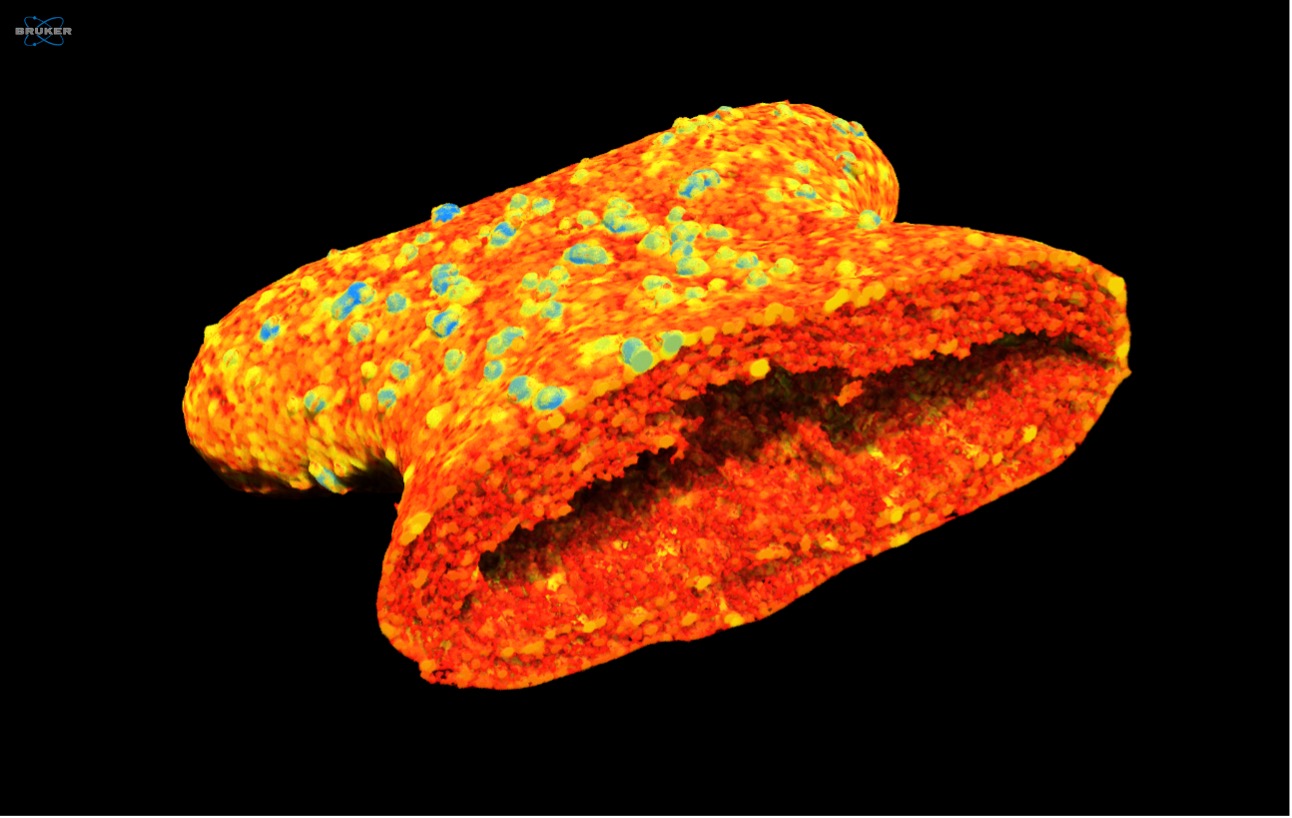
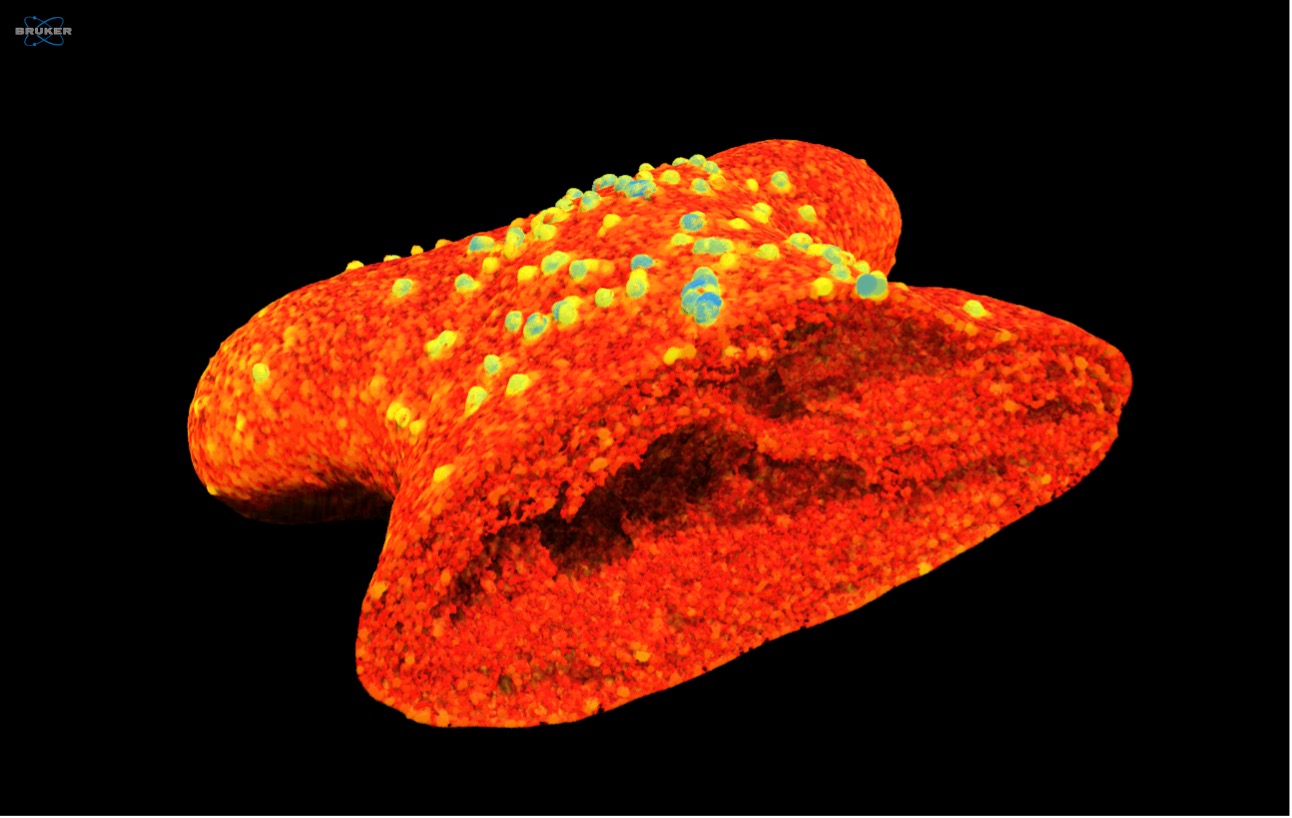
Similar to the last set of images, Figure 7 highlights a color-coded map of the local thickness of the cracker and salt structures in each cracker formulation as computed by CTAn. The traditional formulation has an average thickness of 105.73 ± 8.41 µm while the whole grain formulation has an average thickness of 117.16 ± 8.75 µm. As noted with the porosity, the two formulations are nominally similar to each other when assessed on local cracker and salt thickness across the ten crackers analyzed in this study.
Moving a step beyond just visual comparison, Figure 8 highlights the quantitative comparison of pore size distribution between the two formulation groups. While differences exist between groups and among each group, the overall view of the samples compares quite favorably from one cracker to another despite the formulation group. Similar trends were observed for local thickness also.
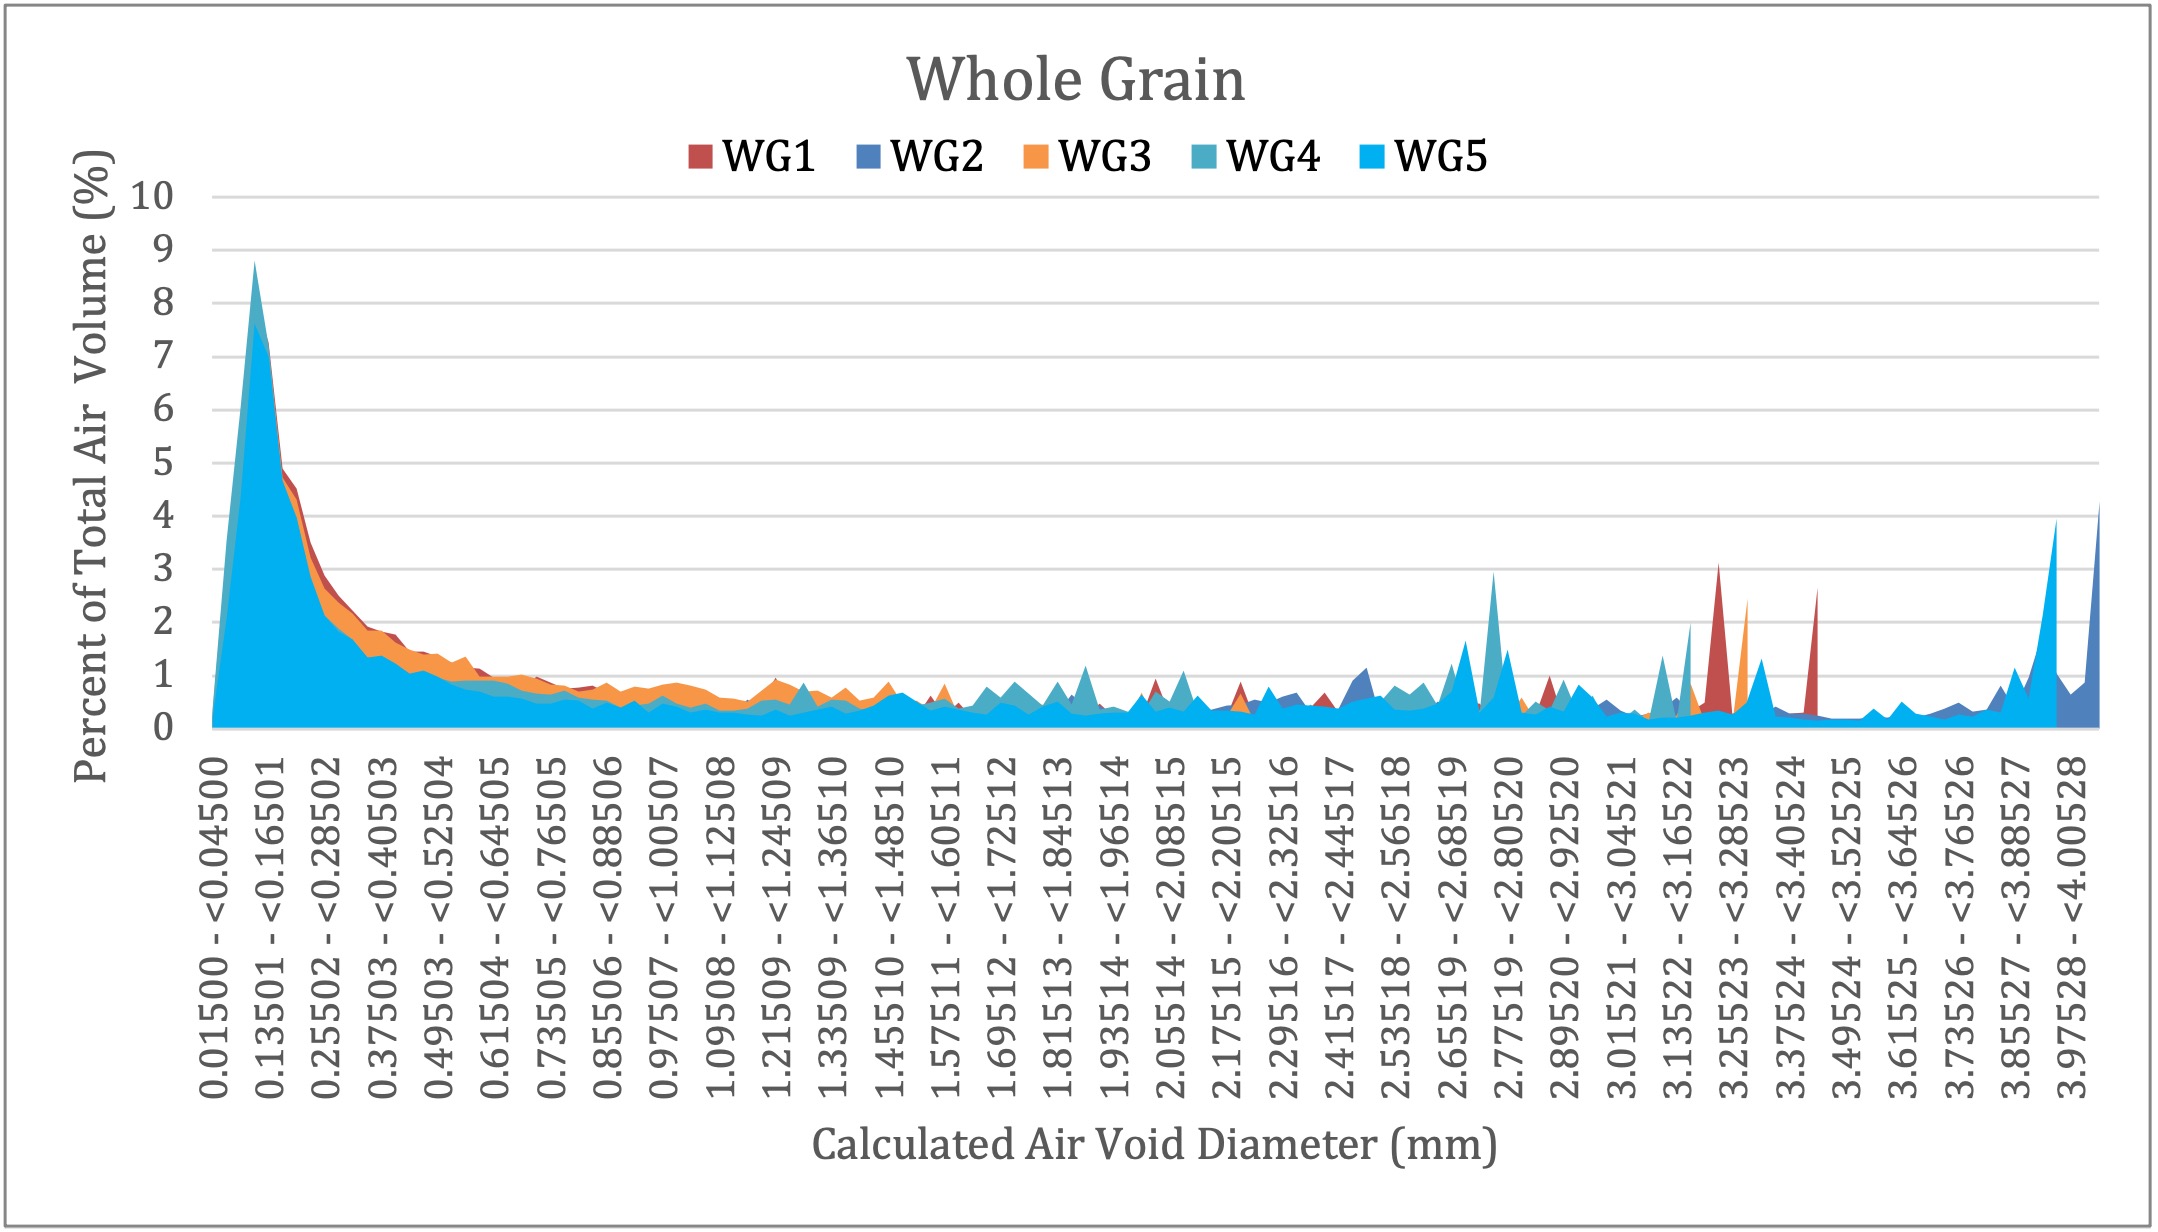
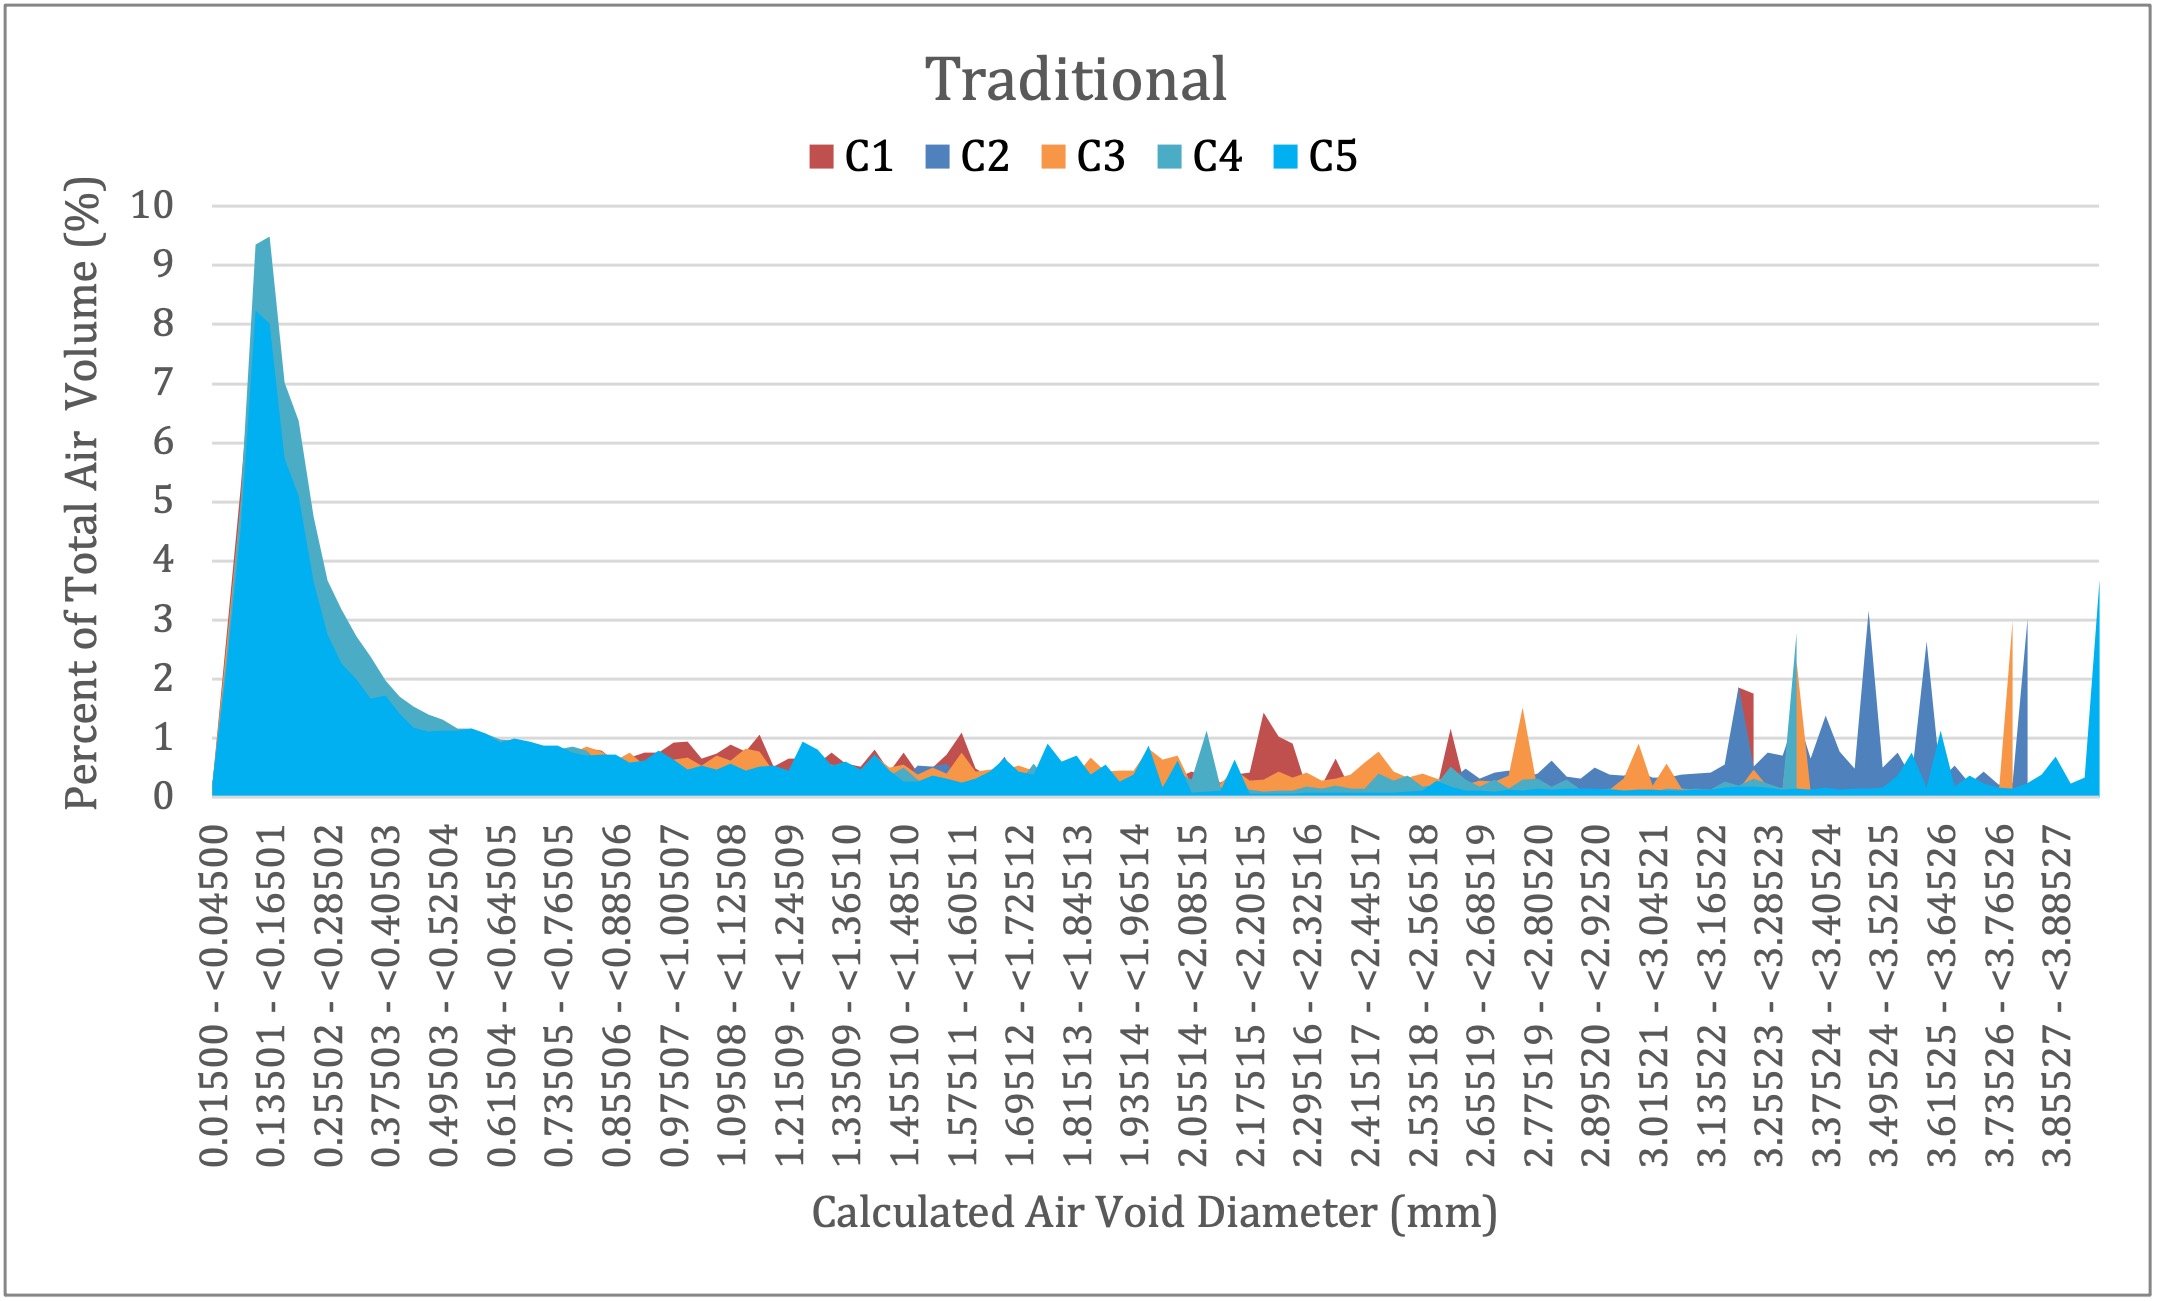
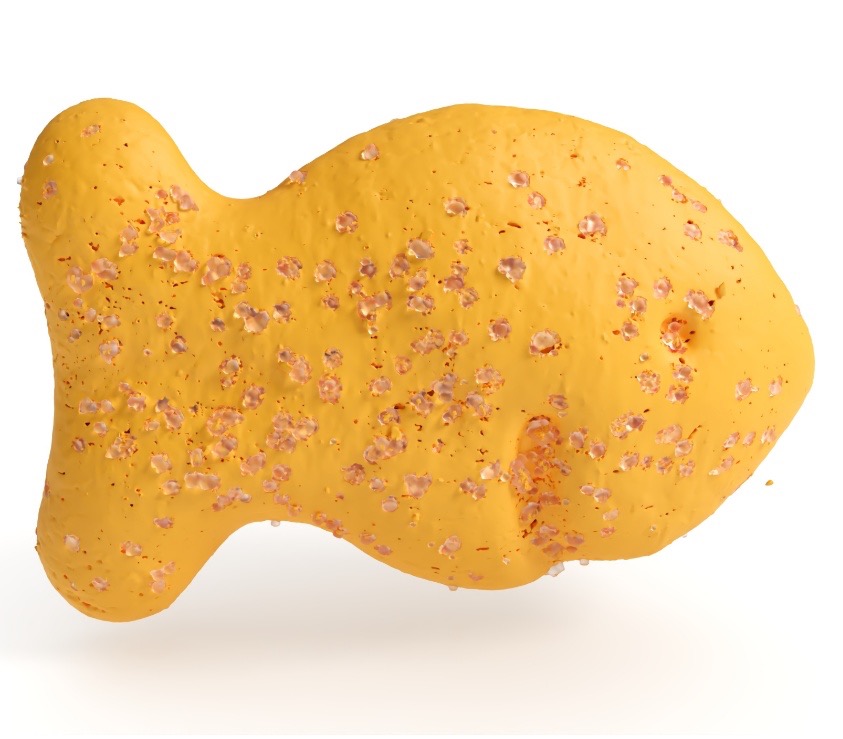
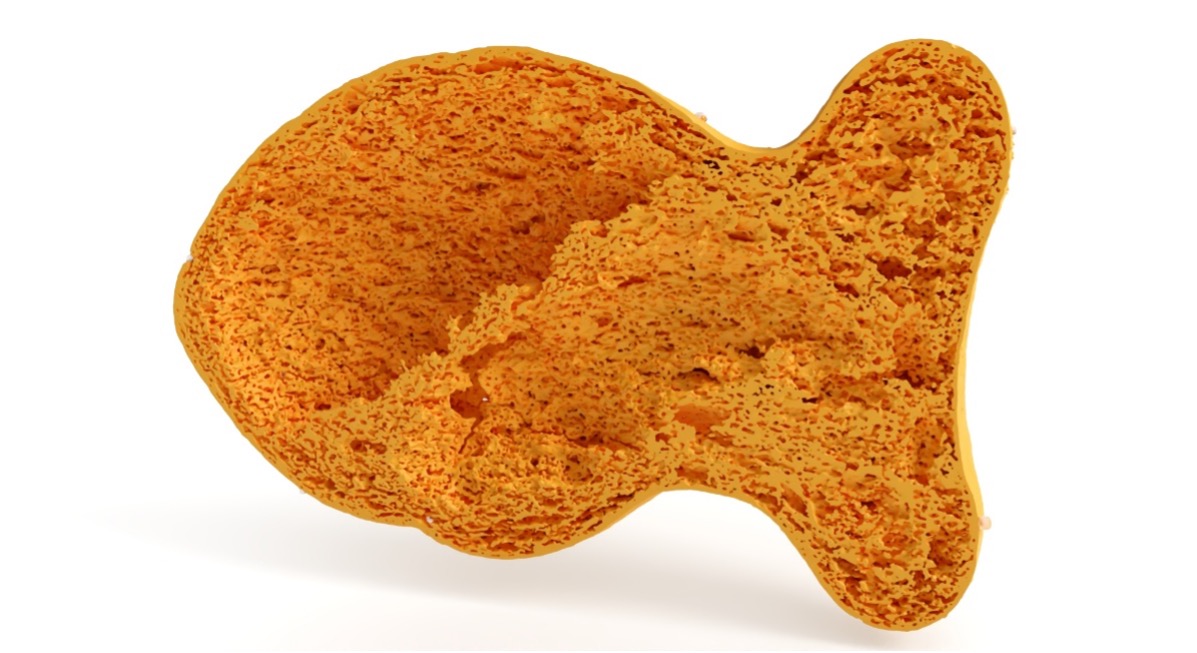
Figure 9 provides photorealistic rendered images of a traditional formulation sample produced from the volumetric models created within Simpleware. By segmenting the salt data and cracker data separately, we can apply different material properties to each volume to produce our final rendered images. This view allows us to accurately render the location and size of the salt crystals on the top surface while also retaining the fine structural details present inside the cracker structure within the sample.
Conclusion
Micro-CT is a versatile technique that can image almost any sample type that both fits within the instrument and allows for X-ray energy to pass through without full attenuation. As our latest step forward in imaging innovation, the Bruker X4 Poseidon desktop micro-CT is available and able to be configured on order based on the specific needs of your unique research needs. Along with the new instrument comes a fully redesigned sample carousel for making the most of the high-throughput imaging capabilities of the high-speed flat panel detector and improving several key aspects of the semi-automated imaging experience compared to both the SkyScan 1272 and SkyScan 1275 instruments. In exploring formulation changes, having an adequate sample size is important for building statistical confidence in the comparison. The use of a carousel allows for the end user to setup up to fifteen samples to run autonomously without human intervention after the initial setup. Without the need for an operator to be present to change samples, the X4 Poseidon makes use of underutilized time overnight to continue running studies ready for the analyst to review the next day.
We hope you find this Image of the Month article informative and encourage you to subscribe to our newsletter and social media channels in preparation for the continuation of our Image of the Month series next month.
Scan Specifications
Sample Cheese Crackers
Detector Flat-panel
Voltage (kV) 50
Current (µA) 200
Filter None
Voxel Size (µm) 15
Rotation Step (deg) 0.4
Exposure Time (ms) 762
Rotation Extent (deg.) 360
Scan Time (HH:MM:SS) 00:42:02
These scans were completed on our Bruker X4 Poseidon instrument at the Micro Photonics Imaging Laboratory in Allentown, PA. Reconstructions were completed using NRecon 2.0 while visualization and volumetric inspection of the 2D and 3D results were completed using DataViewer and CTVox. Quantitative assessments of porosity and pore size distribution were determined using Bruker CTAnalyzer (1.25.0.0). The datasets were converted to volumetric models using Synopsys’ Simpleware software with the CAD add-on module (Synopsys, Inc., Mountain View, USA) before 3D rendering using Maverick Render Indie (Random Control, Madrid, Spain).
References
• amr, ayed, Saleh, M. ., Taibi, A., & AlKhamaiseh, A. M. (2023). Effect of Wheat Bran Levels and Particle Size on the Rheological Properties of Wheat Flour Dough. Jordan Journal of Agricultural Sciences, 19(1), 56–68. https://doi.org/10.35516/jjas.v19i1.155Aune, D., Keum, N., Giovannucci, E., Fadnes, L. T., Boffetta, P., Greenwood, D. C., Tonstad, S., Vatten, L. J., Riboli, E., & Norat, T. (2016). Whole grain consumption and risk of cardiovascular disease, cancer, and all cause and cause specific mortality: Systematic review and dose-response meta-analysis of prospective studies. BMJ, 353, i2716. https://doi.org/10.1136/bmj.i2716
• Doblado-Maldonado, A. F., Pike, O. A., Sweley, J. C., & Rose, D. J. (2012). Key issues and challenges in whole wheat flour milling and storage. Journal of Cereal Science, 56(2), 119–126.
• Packkia-Doss, P., Chevallier, S., Pare, A., & Le-Bail, A. (2019). Effect of supplementation of wheat bran on dough aeration and final bread volume. Journal of Food Engineering, 252, 28–35. https://doi.org/10.1016/j.jfoodeng.2019.01.014
• Van Craeyveld et al. (2020). Selective modification of wheat bran affects its impact on gluten-starch dough rheology, microstructure and bread volume. Food Hydrocolloids.
Would you like your work to be featured in our monthly newsletter? If so, please contact us by calling Seth Hogg at 610-366-7103 or emailing seth.hogg@microphotonics.com.