
Technical Foundations, Quantitative Workflows, and Translational Applications
Click on images to enlarge them for viewing.
If dental function is determined more by internal 3D structure than surface shape, how much are we missing—and misinterpreting—when we rely on 2D radiographs or even CBCT instead of micro-CT?
Part 1:
Introduction: Three-Dimensional Structure as a Determinant of Dental Function
Dental tissues and restorations operate as integrated three-dimensional systems in which function emerges from internal geometry, material gradients, and interfacial integrity rather than from surface morphology alone. At the scale of the whole tooth, crown shape and root hookup influence load transfer and anchorage; at the mesoscale, enamel thickness gradients, dentin elasticity, and pulp chamber geometry govern fracture resistance and fatigue behavior; and at the microscale, dentin tubule orientation and trabecular bone architecture dictate permeability and mechanobiological response (Hildebrand & Rüegsegger, 1997; Bouxsein et al., 2010).
Traditional dental imaging approaches—periapical radiography, cone-beam CT (CBCT), and histological sectioning—each capture only a subset of this hierarchy. Two-dimensional radiographs collapse volumetric information into projection images, obscuring canal bifurcations and cracks, while CBCT remains limited in spatial resolution and grayscale fidelity for fine-scale research questions. Histological sectioning provides cellular detail but introduces deformation, alignment error, and specimen destruction, precluding longitudinal analysis (Metscher, 2009a).
X-ray micro–computed tomography (micro-CT) addresses these limitations by enabling nondestructive, isotropic, three-dimensional imaging of intact dental specimens across a wide range of sizes and material compositions. Micro-CT datasets preserve spatial relationships between enamel, dentin, pulp spaces, restorative materials, and bone, allowing repeated segmentation and quantitative analysis without further specimen manipulation. Consequently, micro-CT now functions as a quantitative imaging backbone in endodontics, cariology, implantology, and dental materials science rather than a purely illustrative technique (Versiani et al., 2013).
A single micro-CT system, unlike clinical CT, can image large specimens like whole jaws at tens of microns and small regions at sub-micron scale.
Part 2:
Fundamentals of Micro-CT Imaging for Dental Specimens
2.1 System Geometry and Reconstruction Principles
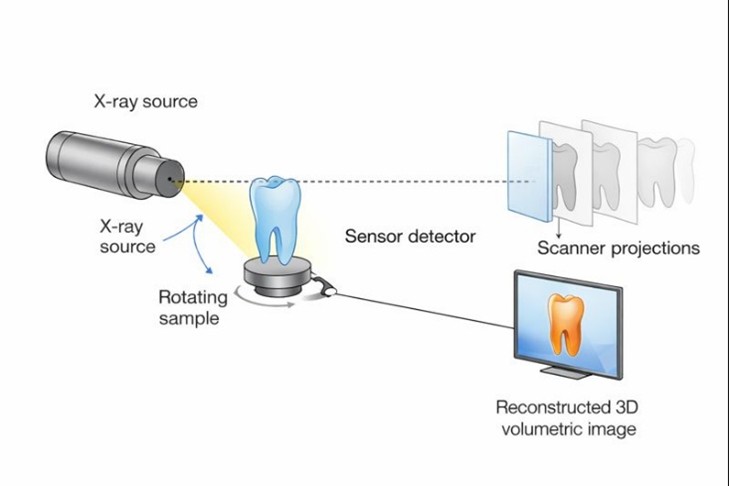
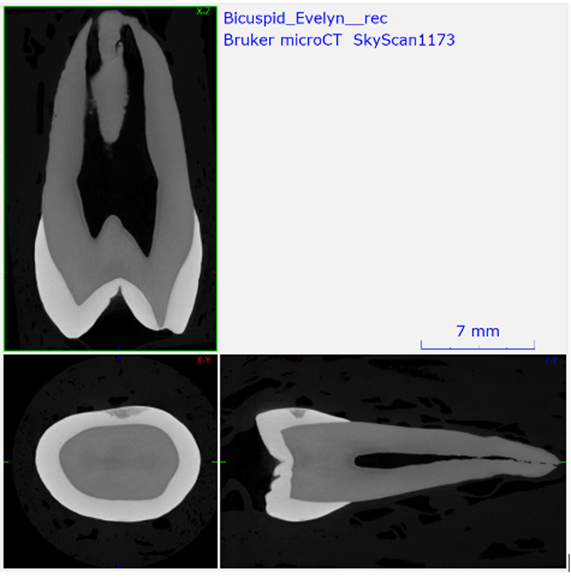
Laboratory micro-CT systems generate three-dimensional datasets by acquiring hundreds to thousands of two-dimensional X-ray projection images as the specimen rotates relative to a fixed X-ray source and detector. For ex vivo dental specimens, this rotating-sample geometry maximizes geometric magnification and spatial resolution while maintaining mechanical simplicity. Projection images are reconstructed using cone-beam filtered back-projection or iterative algorithms to yield isotropic voxel volumes, enabling digital slicing in any plane without loss of resolution.
Dental specimens are particularly well suited to this geometry because teeth, roots, and implants are compact, mechanically stable, and tolerant of long scan durations. Dense enamel and restorative materials impose higher attenuation demands, but modern microfocus sources and high dynamic range detectors accommodate these challenges. Reconstruction software further allows correction for beam hardening, ring artifacts, and misalignment—steps that are critical for quantitative dental analysis.
2.2 Resolution Scaling and Specimen-Dependent Imaging
Unlike clinical CT, spatial resolution in micro-CT is not an intrinsic system constant. Achievable voxel size emerges from the coupled interaction between specimen size, source-to-object distance, object-to-detector distance, X-ray focal spot size, detector pixel pitch, and acquisition parameters such as exposure time and angular sampling (Hildebrand & Rüegsegger, 1997; Bouxsein et al., 2010). This scalability allows a single micro-CT platform to image whole jaws at tens of microns while also resolving dentin tubules or interfacial gaps at sub-micron scales.

For dental research, this flexibility is essential. Endodontic morphology requires sufficient resolution to resolve accessory canals and isthmuses without sacrificing field of view, while caries and demineralization studies demand high grayscale sensitivity and stable density calibration. Implant research often requires compromise between resolution and penetration to image both metal and bone within the same dataset. Micro-CT enables deliberate tuning of these tradeoffs, allowing researchers to design scans around the biological or materials question rather than forcing the question to fit the instrument (Faulwetter et al., 2013).
| Imaging Target | Typical Voxel Size | Primary Research Question |
|---|---|---|
| Human jaw segment | 20–40 µm | Trabecular architecture, implant positioning |
| Whole tooth | 4–10 µm | Root canal morphology, cracks, restorations |
| Dentin tubules | <1 µm | Permeability, hypersensitivity mechanisms |
2.3 Stability and Quantitative Fidelity
Quantitative micro-CT depends critically on system stability over the full duration of a scan. Mechanical drift, thermal expansion, or detector instability introduce grayscale inconsistencies that can bias segmentation of enamel–dentin boundaries, mineral density measurements, or bone–implant interfaces. These effects are amplified in long scans required for high resolution or high filtration imaging of dense dental materials.
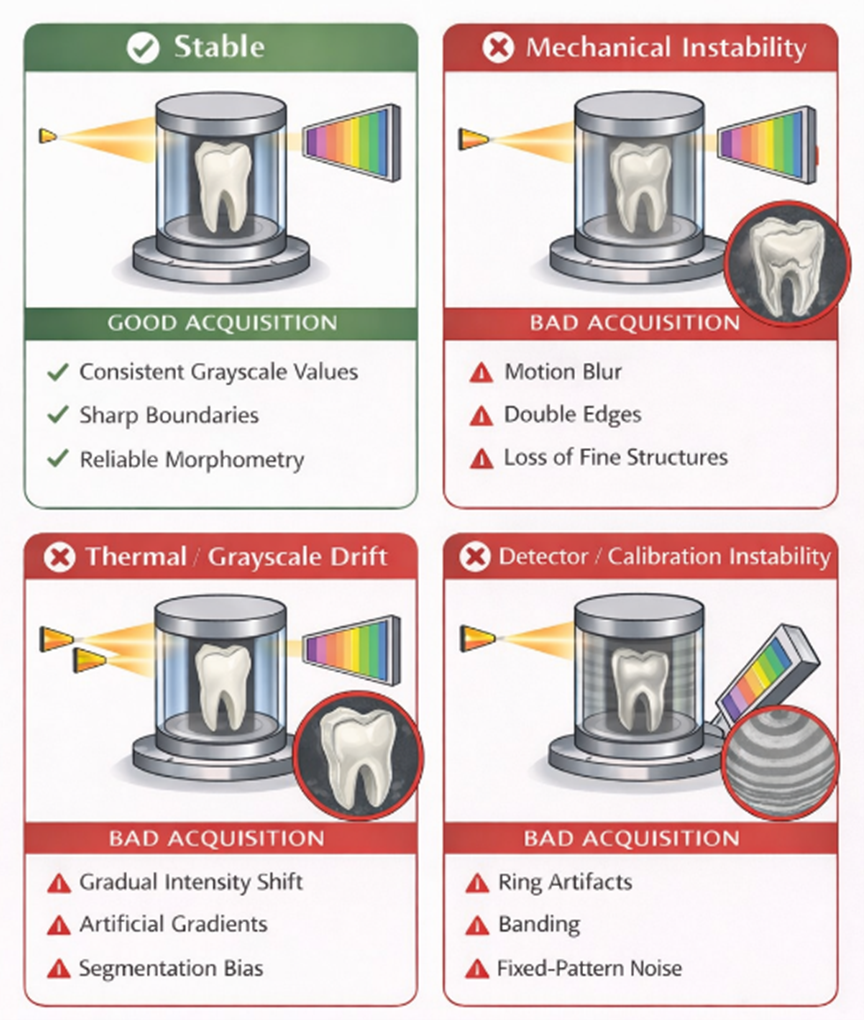
Modern research-grade systems emphasize rigid mechanics, active thermal management, and stable X-ray output to preserve quantitative fidelity. In dental workflows, this stability enables reproducible comparisons across specimens, across time points in longitudinal studies, and across institutions when standardized protocols are used. As a result, micro-CT datasets can be treated as quantitative measurements rather than qualitative images.
2.4 Serial Imaging and Quantitative Treatment Evaluation
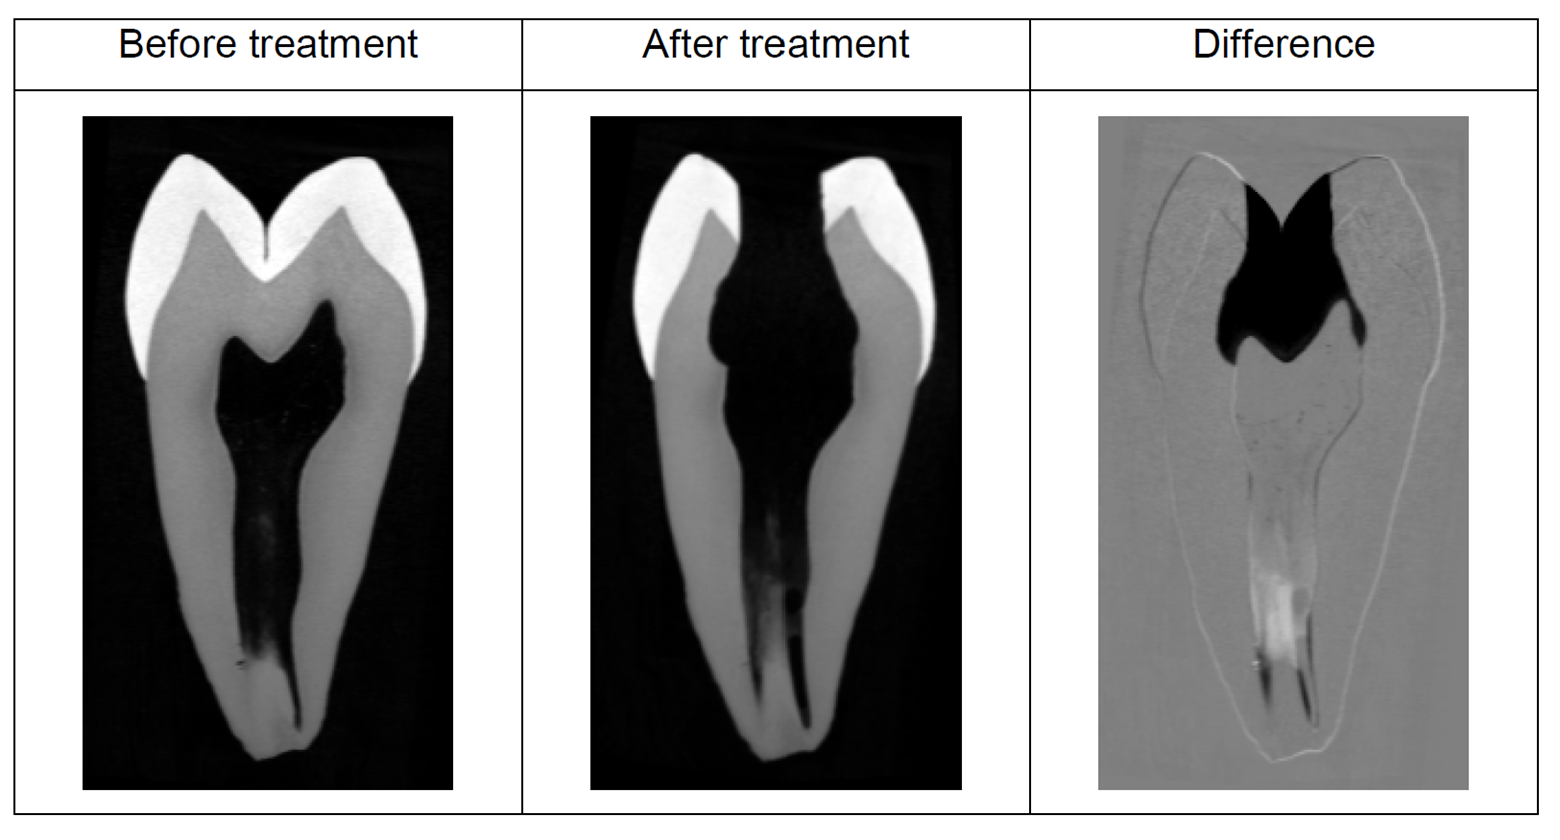
A defining strength of micro-CT in endodontics is its ability to support serial imaging workflows. Pre- and post-treatment scans can be spatially registered to quantify dentin removal, untouched canal walls, debris accumulation, and canal transportation. These metrics provide objective, volumetric measures of shaping performance that complement or replace qualitative assessment (Versiani et al., 2013; Peters et al., 2021).
| Metric | Units | Definition | Measurement Method | Methodological Assumptions & Dependencies |
|---|---|---|---|---|
| Removed dentin volume | mm³ | Total volume of dentin removed during instrumentation | Voxel-wise subtraction of pre- and post-instrumentation datasets following rigid 3D registration | Accurate dataset registration; identical scan parameters; assumes no deformation of the tooth between scans |
| Percentage of untouched canal surface | % | Fraction of original canal wall area not contacted by instruments | Surface extraction from pre-instrumentation canal; comparison with post-instrumentation surface | Requires high-resolution surface rendering; sensitive to threshold selection and partial-volume effects |
| Canal transportation | mm | Deviation of the canal centerline from its original position | Center of mass or centerline displacement measured at defined cross-sectional levels | Assumes consistent slice orientation; sensitive to voxel size and canal segmentation accuracy |
| Centering ratio | Unitless ratio (0–1) | Degree to which preparation remains centered within the original canal | Ratio of material removed from opposing canal walls | Depends on symmetric segmentation; assumes cylindrical or quasi-cylindrical canal geometry |
| Increase in canal volume | mm³ | Net change in canal lumen volume after preparation | Volume difference between segmented canal spaces before and after treatment | Requires stable grayscale calibration; assumes no debris falsely classified as canal space |
| Change in canal surface area | mm² | Increase in exposed canal wall surface due to instrumentation | Surface mesh comparison between datasets | Sensitive to smoothing and surface extraction parameters |
| Debris accumulation volume | mm³ | Volume of dentin debris remaining within the canal system | Segmentation of high-density debris within canal space | Requires sufficient contrast between debris and canal lumen; depends on filtration and beam hardening correction |
| Apical foramen deformation | mm² or mm | Change in size or shape of the apical opening | Cross-sectional area measurement at apical slices | High resolution required; assumes precise identification of anatomical apex |
| Structural integrity (microcracks) | Count or presence/absence | Detection of new cracks induced by instrumentation | Visual and quantitative comparison of pre- and post-treatment datasets | Limited by voxel size; requires dehydration control to avoid artifact-induced cracks |
Notes for Methods and Reviewers
- Registration: Rigid 3D registration is essential; non-rigid registration is generally avoided to preserve anatomical truth.
- Voxel size: Typically 5–20 µm for whole-tooth endodontic studies; smaller voxels improve crack detection but increase noise.
- Thresholding: Global thresholding is preferred for canal space; adaptive or region-based methods may be required for debris analysis.
- Reproducibility: Identical scan geometry and reconstruction parameters are mandatory for valid serial comparisons.
Micro-CT doesn’t just show structure—it can reveal hidden mineral changes and interfaces in 3D and convert contrast into quantitative measurements, which most dental imaging methods can’t do.
Part 3:
Contrast Mechanisms in Dental Micro-CT
3.1 Intrinsic Absorption Contrast in Mineralized Tissues
Intrinsic contrast in dental micro-CT arises primarily from photoelectric absorption, which scales strongly with effective atomic number and density. Enamel, dentin, alveolar bone, and many restorative materials therefore exhibit high natural contrast without the need for staining. This intrinsic contrast underlies micro-CT’s widespread adoption in endodontics and implant research, where interfaces between mineralized tissues and voids or materials are of primary interest.
Because grayscale values correspond directly to X-ray attenuation, intrinsic contrast datasets can be used for quantitative mineral density assessment when appropriate calibration phantoms and beam hardening corrections are applied. This capability distinguishes micro-CT from conventional radiography, enabling volumetric density mapping rather than qualitative brightness comparison.

3.2 Demineralization, Remineralization, and Density Mapping
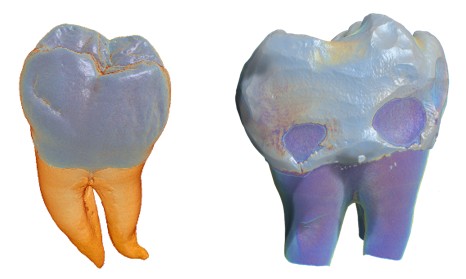
Micro-CT provides a uniquely powerful approach for studying demineralization processes because it captures mineral loss in three dimensions while preserving specimen integrity. Carious lesions, erosion fronts, and hypomineralized regions can be segmented volumetrically, allowing direct measurement of lesion depth, volume, and mineral density gradients. Repeated scanning of the same specimen further enables longitudinal studies of remineralization treatments without destructive sampling (Fagrell et al., 2013).

In conditions such as molar–incisor hypomineralization (MIH), micro-CT reveals spatial patterns of density reduction that differ fundamentally from caries, often originating near the enamel–dentin junction and propagating outward. These volumetric observations provide mechanistic insight into ameloblast dysfunction and enamel maturation disturbances and correlate closely with histological findings (Fagrell et al., 2013; Salmon et al., 2024).
| APPLICATION | QUANTITATIVE OUTPUT | UNITS | CALIBRATION ASSUMPTIONS | ACQUISITION & ANALYSIS DEPENDENCIES |
|---|---|---|---|---|
| Caries progression | Mineral density vs. depth profiles | mg HA/cm³ (or relative attenuation units) | Grayscale values are calibrated using hydroxyapatite (HA) phantoms of known density; beam hardening correction applied; linear attenuation assumed proportional to mineral content | High signal-to-noise ratio; stable X-ray output; consistent filtration; small voxel size (≤10 µm) to resolve subsurface lesions; profiles extracted perpendicular to enamel surface |
| Remineralization studies | Recovered mineral volume and spatial distribution | mm³ (volume), mg HA/cm³ (density) | Pre- and post-treatment scans are intensity-normalized using the same HA calibration; rigid registration assumes no specimen deformation between scans | Identical scan parameters across time points; precise dataset registration; thermal and mechanical stability to avoid grayscale drift; voxel-wise subtraction or threshold-based segmentation |
| Molar–incisor hypomineralization (MIH) | Enamel density gradients and lesion geometry | mg HA/cm³; mm (lesion depth); mm³ (lesion volume) | HA phantom calibration valid across enamel thickness; grayscale gradients reflect intrinsic hypomineralization rather than surface demineralization | Moderate to high resolution (5–10 µm); wide dynamic range detector; careful beam hardening correction; segmentation guided by density histograms rather than fixed thresholds |
| Comparative enamel/dentin analysis | Mean and distribution of mineral density | mg HA/cm³ | Assumes homogeneous calibration across field of view; density differences reflect true tissue composition | Uniform illumination; detector flat-field correction; exclusion of partial-volume voxels at tissue boundaries |
| Treatment or material comparison | Relative mineral density change (%) | % change relative to baseline | Baseline scan serves as internal calibration reference; assumes linear response of grayscale values | Identical geometry and scan parameters; robust image registration; noise suppression without edge blurring |
3.3 Imaging Dense Materials and Metal Implants
Dental micro-CT frequently involves imaging dense, highly attenuating materials such as titanium implants, stainless steel instruments, and zirconia restorations. These materials increase beam hardening and streak artifacts, which can obscure adjacent bone or cement layers if not properly managed. High tube voltages, appropriate spectral filtration, increased projection counts, and optimized reconstruction parameters are therefore essential.

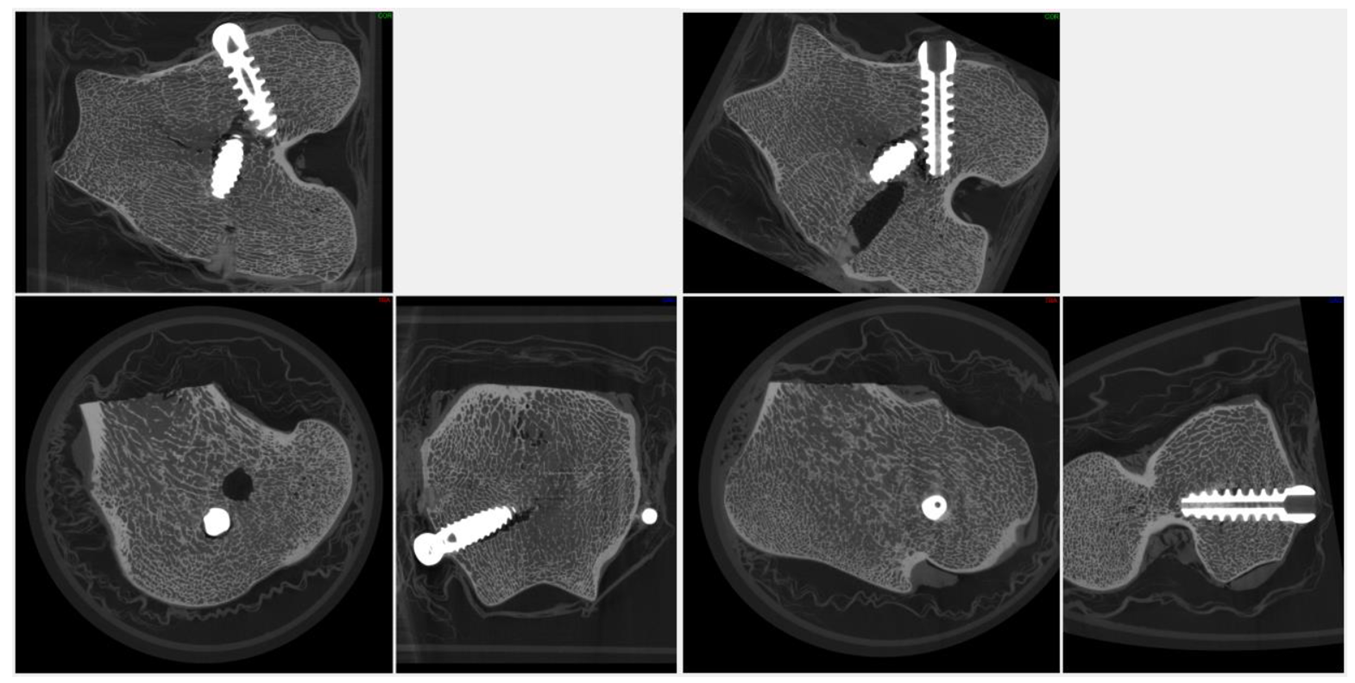
When optimized, micro-CT enables simultaneous visualization of metal components and surrounding bone microarchitecture, supporting quantitative assessment of osseointegration and material performance. Advanced acquisition modes such as helical scanning can further reduce artifacts in challenging geometries, expanding the range of dental applications accessible to micro-CT.
High-attenuation dental materials, including titanium implants and zirconia restorations, generate pronounced beam hardening and photon starvation artifacts that appear as streaking and grayscale distortion in CT imaging; mitigation of these effects requires elevated tube voltages and appropriate spectral filtration to harden the X-ray beam, and can be further improved through helical (spiral) scanning geometries that reduce angular undersampling and distribute metal-induced artifacts across the reconstructed volume (Barrett & Keat, 2004).
3.4 Acquisition and Reconstruction Parameters for Dental Micro-CT Samples
High-quality, quantitative dental micro-CT data depend as much on acquisition and reconstruction choices as on nominal system resolution. Teeth and implants present a challenging combination of dense mineralized tissue, fine internal features, and high-contrast material interfaces. As a result, parameter selection must be guided by both physical principles and the specific biological or materials question.
Tube Voltage and Filtration. Enamel, dentin, and bone require sufficient photon energy to ensure penetration without saturating the detector. Typical dental scans are performed between 60–100 kV for isolated teeth and up to 120–140 kV for implants or jaw segments. Metallic implants benefit from additional filtration (e.g., aluminum, copper, or molybdenum) to reduce beam hardening and suppress low-energy photons that contribute disproportionately to artifacts.
Exposure Time and Angular Sampling. Fine-scale endodontic features such as accessory canals or microcracks require high signal-to-noise ratio and dense angular sampling. Increasing exposure time and projection count improves reconstruction fidelity but must be balanced against scan duration and potential thermal drift. Dental micro-CT studies commonly employ 800–3,000 projections over 360°, with frame averaging for noise reduction.
Reconstruction Parameters. Reconstruction algorithms incorporate beam hardening correction, ring artifact suppression, and smoothing filters. For dental applications, conservative smoothing is preferred to avoid blurring canal walls or crack tips, while beam hardening correction is critical for maintaining accurate grayscale separation between enamel, dentin, and restorative materials.
| Parameter | Typical Dental Range | Primary Effect |
|---|---|---|
| Tube voltage | 60–140 kV | Penetration, contrast balance |
| Filtration | Al, Cu, Mo | Beam hardening reduction |
| Projections | 800–3,000 | Reconstruction fidelity |
| Frame averaging | 2–8X | Noise reduction |
Micro-CT enables nondestructive 3D detection of enamel and dentin microcracks—revealing initiation and propagation patterns while helping researchers distinguish true fatigue or instrumentation damage from dehydration-induced defects that can otherwise confound endodontic studies.
Part 4:
Tooth Morphometry and Endodontic Research Applications
4.1 Root Canal System Complexity
Root canal systems exhibit substantial anatomical variability, including bifurcations, accessory canals, apical deltas, and complex cross-sectional geometries. Micro-CT has become the reference standard for documenting this complexity because it preserves the intact three-dimensional network without interpretive bias from sectioning or projection overlap. Detailed morphometric analysis supports both anatomical classification and evaluation of instrumentation strategies.
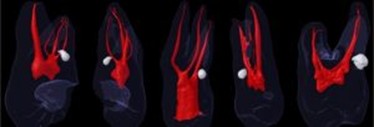
By resolving canal curvature, taper, and connectivity in three dimensions, micro-CT data inform the design of endodontic instruments and the development of preparation protocols aimed at maximizing cleaning while minimizing dentin removal and procedural error.

4.2 Detection of Enamel and Dentin Cracks
Micro-CT enables nondestructive detection of microcracks in enamel and dentin that may be invisible clinically or radiographically. Three-dimensional visualization reveals crack initiation sites, propagation paths, and relationships to dehydration, instrumentation, or occlusal loading. These insights are critical for understanding iatrogenic damage and fatigue-related failure mechanisms.

The hydration state of dentin plays a critical role in its mechanical behavior and structural integrity, with water loss significantly altering stress distribution and fracture susceptibility. In vitro imaging studies have demonstrated that dehydration alone can induce dentinal crack formation, independent of endodontic instrumentation, suggesting that moisture-related shrinkage generates internal stresses capable of damaging root structure. These effects may confound interpretations of crack formation in micro–computed tomography–based endodontic studies if hydration conditions are not rigorously controlled or reported. Consequently, maintaining and documenting specimen hydration is essential for ensuring the validity and reproducibility of micro-CT assessments of dentinal defects. (Shemesh H, et al., 2018)
Micro-CT enables dental implant researchers to quantify osseointegration in three dimensions by measuring peri-implant bone microarchitecture—providing structural metrics that correlate with mechanical stability and load transfer.
Part 5:
Dental Implants and Bone–Implant Integration
5.1 Quantitative Assessment of Osseointegration
Micro-CT provides a direct, three-dimensional means of quantifying peri-implant bone microarchitecture. By defining standardized volumes of interest around the implant surface, researchers can measure bone volume fraction, trabecular thickness, separation, and connectivity density. These parameters correlate with mechanical stability and load transfer capacity, supporting both fundamental research and preclinical evaluation of implant designs (Pauwels et al., 2013; Bouxsein et al., 2010).
| Metric | Units | Definition | Biological / Mechanical Relevance | Measurement Considerations |
|---|---|---|---|---|
| Bone volume fraction (BV/TV) | % or unitless ratio | Ratio of bone volume to total volume within a defined peri-implant region of interest | Primary indicator of osseointegration and peri-implant bone support | Requires consistent VOI definition; sensitive to thresholding and beam hardening correction |
| Trabecular thickness (Tb.Th) | µm | Mean thickness of trabecular elements surrounding the implant | Reflects mechanical competence and load-bearing capacity of peri-implant bone | Influenced by voxel size; partial-volume effects must be minimized |
| Trabecular separation (Tb.Sp) | µm | Mean distance between trabeculae | Indicates porosity and space available for vascularization | Requires accurate bone segmentation; sensitive to noise |
| Trabecular number (Tb.N) | 1/mm | Number of trabeculae per unit length | Describes trabecular network density | Assumes isotropic trabecular structure within VOI |
| Connectivity density (Conn.D) | 1/mm³ | Measure of trabecular network connectivity per unit volume | Relates to load distribution and structural redundancy | Sensitive to segmentation errors and VOI size |
| Bone–implant contact (BIC) | % | Fraction of implant surface directly contacting bone | Indicator of primary and secondary implant stability | Metal artifacts must be minimized; surface definition depends on resolution |
| Peri-implant bone density | mg HA/cm³ | Mean mineral density of bone adjacent to the implant | Correlates with bone quality and mechanical strength | Requires calibrated grayscale values using HA phantoms |
| Bone ingrowth depth | mm | Radial extent of bone penetration toward or into implant features | Relevant for porous or threaded implant designs | Dependent on implant geometry and VOI alignment |
5.2 Materials, Scaffolds, and Regenerative Strategies
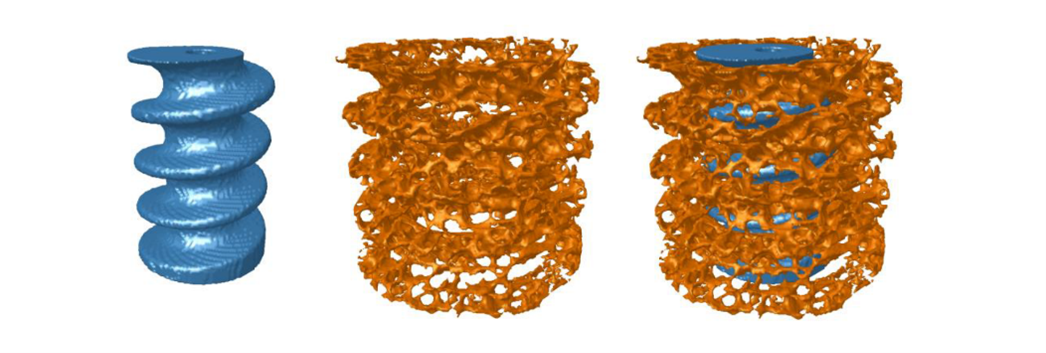
Beyond conventional implants, micro-CT plays a central role in evaluating bone grafts, bioactive coatings, and tissue engineering scaffolds. Porosity, pore size distribution, and interconnectivity can be quantified in three dimensions, enabling correlation with vascularization, bone ingrowth, and mechanical performance. Because these structures are often heterogeneous, volumetric imaging is essential for meaningful characterization.
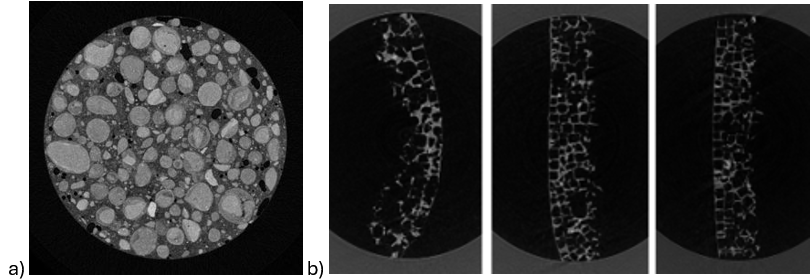
Porosity is a defining structural property of scaffold implants because it determines the volume fraction of void space available for tissue ingrowth, vascularization, and nutrient transport. Micro-CT analysis shows that total porosity alone is insufficient to predict biological performance; instead, the spatial distribution of solid material and voids must be quantified in three dimensions to ensure repeatable and biologically relevant measurements.
High porosity increases surface area and space for calcified or soft-tissue infiltration, but if pore dimensions approach the voxel size or are poorly resolved, segmentation accuracy and derived metrics become unreliable. Consequently, high-resolution micro-CT imaging is essential to minimize partial-volume effects and enable robust quantification of scaffold architecture, including thickness and separation of structural elements.

Equally important is pore interconnectivity, which governs scaffold permeability and determines whether internal pore spaces are accessible to cells, fluids, and vasculature. Most biological scaffolds do not contain isolated, discrete pores; instead, they form a highly interconnected pore network in which nearly all internal space is theoretically connected to the exterior in three dimensions.
Micro-CT–based analyses therefore focus on characterizing accessibility of this interconnected pore space using virtual object or “virtual sphere” methods, which assess the maximum pore size through which cells could realistically migrate. These analyses demonstrate that although overall interconnectivity may exceed 98%, functional permeability decreases sharply as the required passage diameter increases, linking scaffold architecture directly to biological feasibility of cell ingrowth and tissue regeneration.
Is your micro-CT platform truly matched to your application—or are compromises in field of view, resolution, X-ray power, or detector performance subtly limiting the accuracy and translational value of your findings?
Part 6:
System Selection by Dental Research Application
Different dental research questions place distinct demands on field of view, resolution, X-ray power, and detector technology. Selecting an appropriate micro-CT platform therefore requires aligning system capabilities with specimen size, material density, and throughput requirements.
| Research Application | Key Imaging Requirements | Current Micro-CT Platform (Legacy Systems) | Technical Rationale / Notes |
|---|---|---|---|
| Root canal morphology | High spatial resolution; moderate field of view | X4 Hi-Res (SkyScan 1272) | Optimized for fine canal segmentation, accessory canals, and crack detection with improved stability and throughput |
| Serial endodontic instrumentation | Long-term mechanical and grayscale stability; accurate registration | X4 Hi-Res + MultiVision (SkyScan 1172, 1272) | Supports robust pre-/post-instrumentation registration and quantitative dentin removal analysis |
| Whole tooth + restorations | Larger field of view; high dynamic range | X4 Workhorse + MultiVision (SkyScan 1275) | Replaces large-sample dental workflows with faster acquisition and flexible detector configurations |
| Dental scaffolds (porosity & structure thickness) | High spatial resolution; accurate segmentation of thin struts and interconnected pores | X4 Hi-Res (SkyScan 1172, 1272) | High resolution is required to quantify pore size distribution, strut thickness, and interconnectivity while minimizing partial-volume effects |
| Larger dental specimens and dense materials | Large field of view; higher X-ray power; filtration | SkyScan 1273 (SkyScan 1173, 1174) | Well suited for larger teeth, multi-tooth samples, and denser restorative or metallic components |
| Dense dental materials (implants, zirconia) | High tube power; filtration; artifact mitigation | SkyScan 2214 (SkyScan 1173, 1174) | Advanced artifact reduction, filtration, and helical scanning for metal and high-Z materials |
| Submicron dentin tubules | Nano-focus source; submicron voxel size | SkyScan 2214 (SkyScan 2211) | Consolidates nano-CT capability with broader specimen size flexibility |
| Multi-scale dental research | Submicron to millimeter-scale objects | SkyScan 2214 (Multiple systems previously required) | Single platform spanning dentin ultrastructure to whole-tooth and jaw-scale imaging |
| Cross-application flexibility | Rapid switching between resolution, speed, and field of view | MultiVision (X4 platforms) (Manual detector changes) | Enables rapid configuration changes without physical detector swaps |
Notes
- Legacy SkyScan systems are shown for historical context and literature continuity.
- SkyScan 1273 is retained as a key platform for larger field-of-view and denser dental applications, bridging traditional micro-CT and high-power workflows.
- SkyScan 2214 serves as the primary multi-scale, high-performance platform, consolidating several legacy use cases.
- The X4 Poseidon is available in multiple configurations, enabling a broad range of desktop micro-CT dental applications.
Case studies are especially important in dental research because they reveal more rare but clinically critical internal anatomy and failure mechanisms—details that can directly influence diagnosis, treatment decisions, and material performance, yet are often missed or averaged out in large-scale studies.
Part 7:
Case Studies in Dental Micro-CT Research
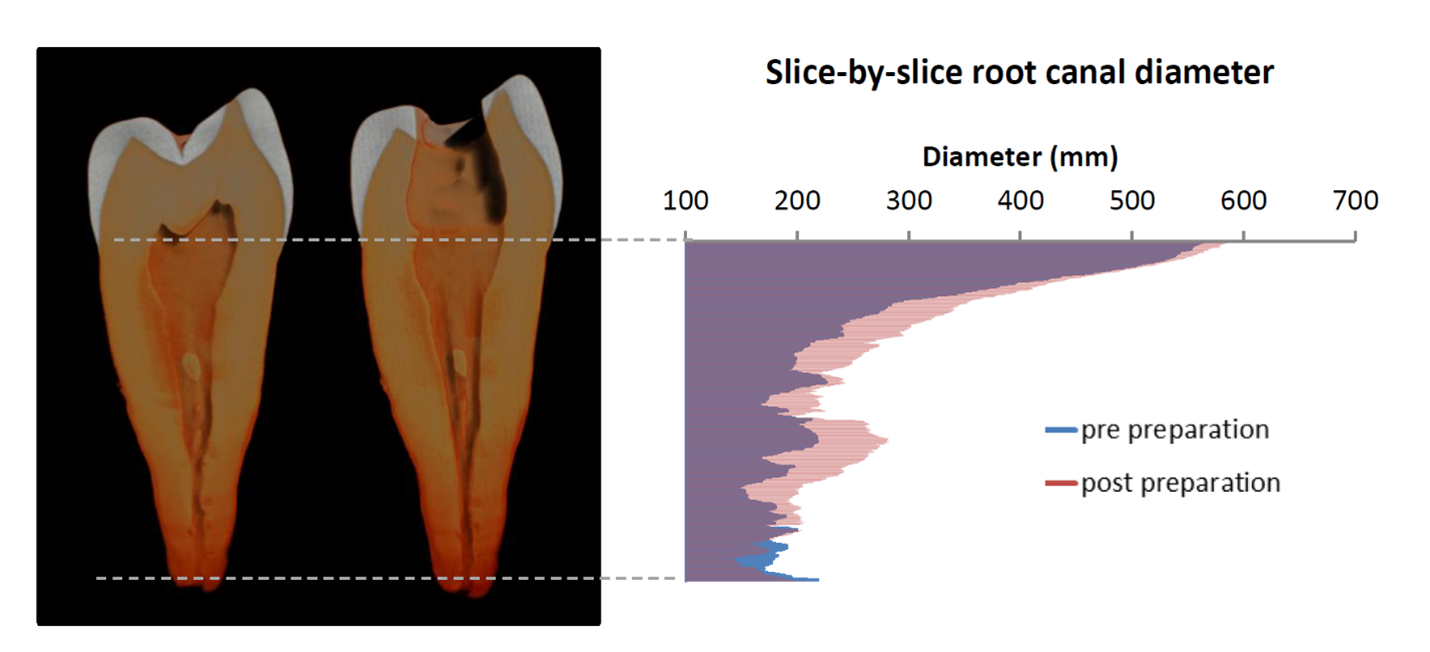
Case Study 1: Serial Micro-CT of Root Canal Instrumentation
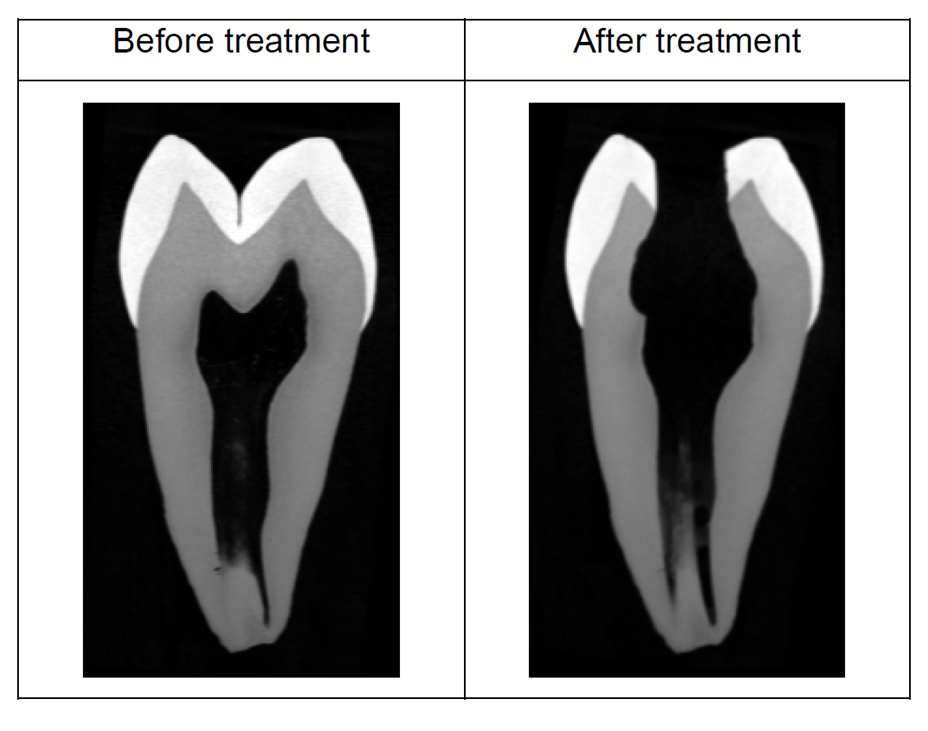
Serial micro-CT imaging has become a gold-standard methodology for evaluating endodontic instrumentation. In this workflow, extracted teeth are scanned prior to treatment, after shaping, and optionally after obturation. Datasets are spatially registered to isolate material removal, debris accumulation, and untouched canal surfaces. These volumetric metrics provide objective, quantitative measures of shaping efficiency and anatomical preservation that are not accessible with conventional imaging.
Key Outcomes: – Quantification of dentin removed as a function of canal level – Identification of untouched canal walls in oval or ribbon-shaped canals – Measurement of canal transportation and centering ability.
Case Study 2: Micro-CT Analysis of Demineralization and MIH
Micro-CT mineral density mapping has been instrumental in differentiating caries-related demineralization from developmental enamel defects such as MIH. In MIH, hypomineralized regions frequently originate near the enamel–dentin junction and extend outward, contrasting with surface-initiated carious lesions. Volumetric density gradients obtained from micro-CT provide mechanistic insight into enamel maturation disturbances and support correlation with histological findings.
Key Outcomes: – Three-dimensional lesion geometry and volume – Depth-resolved mineral density profiles – Differentiation between developmental and pathological demineralization.
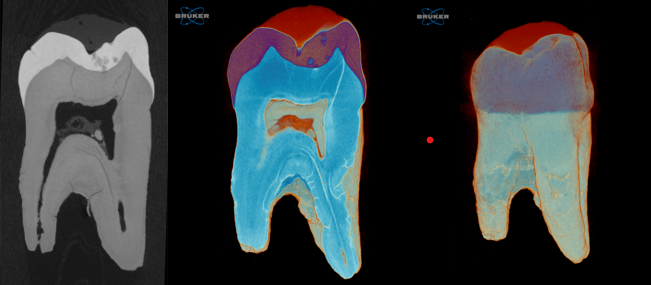
Case Study 3: Quantitative Micro-CT Analysis of Gaps, Voids, and Porosity in Dental Fillings
Micro-CT enables nondestructive, three-dimensional evaluation of the internal integrity of dental filling materials, allowing direct visualization and quantification of gaps, voids, and porosity that are not detectable with conventional radiographic techniques. In this example, a human molar containing a root canal filling was scanned at high spatial resolution (4 µm voxel size), producing both reconstructed cross-sectional images and full three-dimensional renderings of the tooth–filling system. Segmentation of the filling material followed by local thickness analysis revealed heterogeneous internal porosity as well as gaps at the dentin–filling interface.
Quantitative analysis of the micro-CT dataset enabled objective assessment of void volume, gap thickness, and spatial distribution of defects within the filling. Three-dimensional local thickness mapping distinguished isolated internal pores from continuous interfacial gaps that may serve as preferential leakage pathways along the canal wall. This workflow supports comparative evaluation of obturation materials and techniques and provides a quantitative basis for assessing filling quality and sealing performance.
Key Outcomes: – Quantification of void volume within dental filling materials – Identification of gaps at the dentin–filling interface – Differentiation between isolated porosity and continuous leakage pathways.

How scans are performed and analyzed directly affects the accuracy, reproducibility, and clinical relevance of the results.
Part 8:
Methodologies
Methodology 1: Serial Micro-CT Evaluation of Root Canal Instrumentation
(Based on Bruker method note MN047 – Root Canal Treatment Evaluation)
Purpose: Quantitative assessment of dentin removal, canal shaping, and geometric changes induced by endodontic instrumentation using paired pre- and post-treatment micro-CT datasets.
Workflow and Analysis Steps
- Specimen Scanning (Pre/Post)
- Scan each tooth before and after instrumentation using identical scan geometry, filtration, and reconstruction parameters to ensure comparability.
- Typical settings include 60–100 kV tube voltage with Al or Cu+Al filtration to minimize beam hardening.

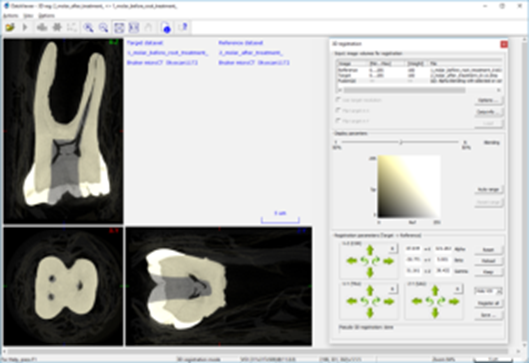
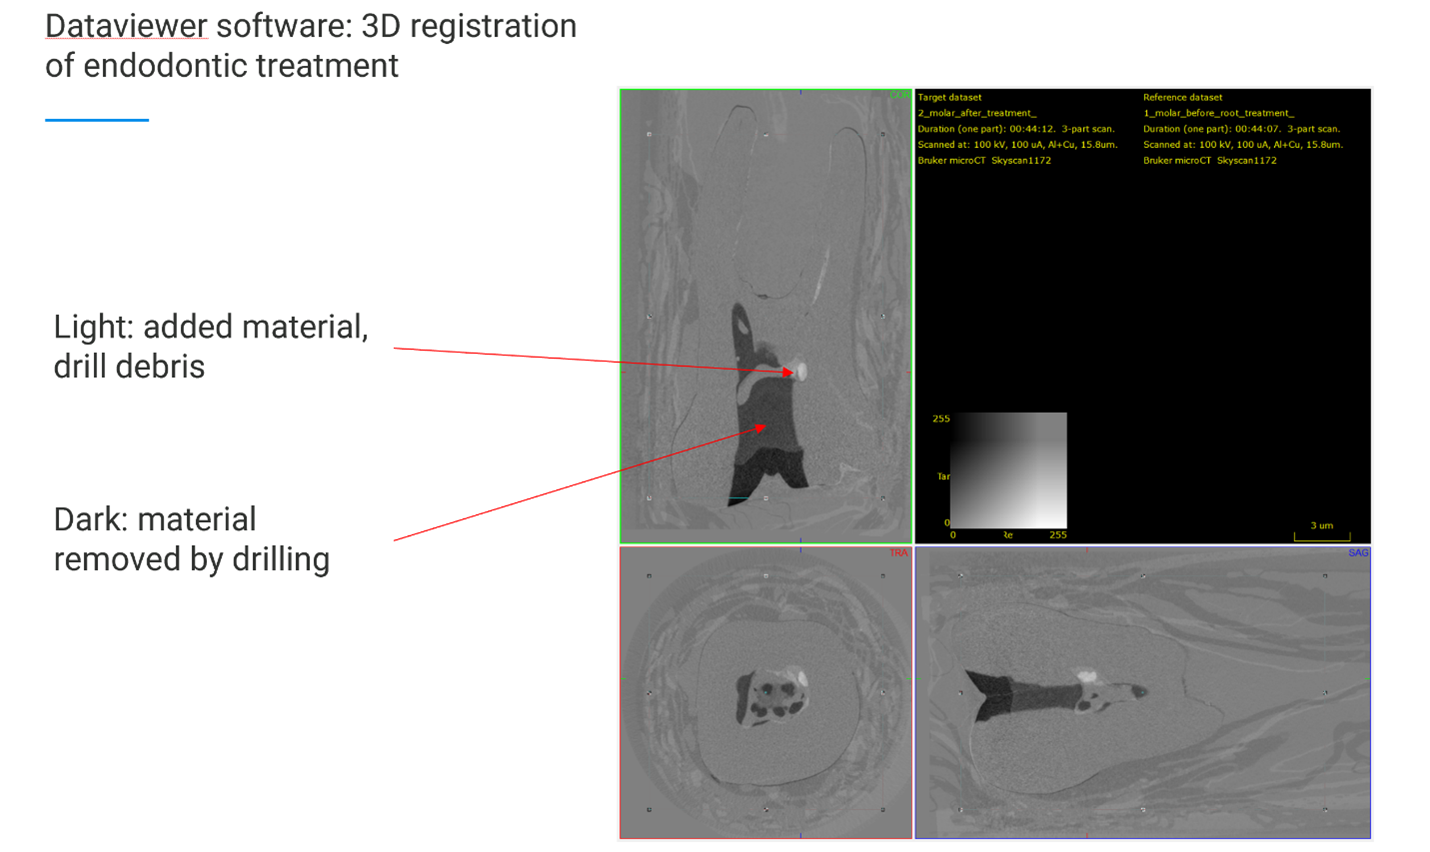
- 3D Dataset Registration
- Import reconstructed datasets into DataViewer.
- Perform automatic 3D registration aligning post-treatment scans (“target”) to pre-treatment scans (“reference”).
- Save reference, target, and difference datasets.

- Root-Only Volume of Interest (VOI) Definition
- In CTAn, restrict analysis to the root by defining top and bottom slice limits, excluding enamel and crown.
- Threshold dentin and apply a shrink-wrap ROI around the root.
- Root Canal Segmentation
- Invert the dentin binary image.
- Apply a logical AND with the ROI to isolate the root canal space.
- Remove isolated speckles using 3D sweep and despeckle functions.
- Quantitative Metrics
- Calculate:
- Volume of dentin removed (via difference dataset or pre/post subtraction)
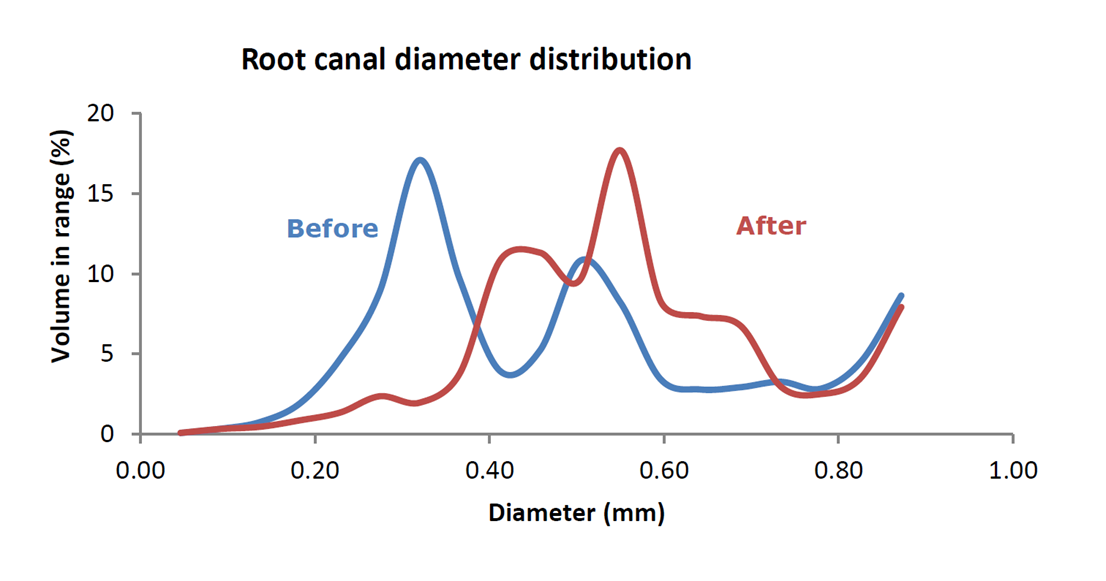
- Canal diameter and thickness distributions
- Slice-by-slice canal enlargement along the long axis

- Calculate:
Methodology 2: Bone–Implant Contact (BIC) and Peri-Implant Bone Analysis
(Based on method note MN074 – Bone Around Metal Implant, 3D–2D BIC)
Purpose: Standardized 3D and 2D quantification of bone architecture and bone–implant contact surrounding metallic dental or orthopedic implants.
Workflow and Analysis Steps
- Scan Orientation and Reconstruction
- Align the implant long axis with the dataset Z-axis in DataViewer to ensure consistent cross-sectional analysis.
- Use elevated tube voltage and appropriate filtration (e.g., Mo, Cu) to reduce metal-induced artifacts.

- Volume of Interest (VOI) Definition
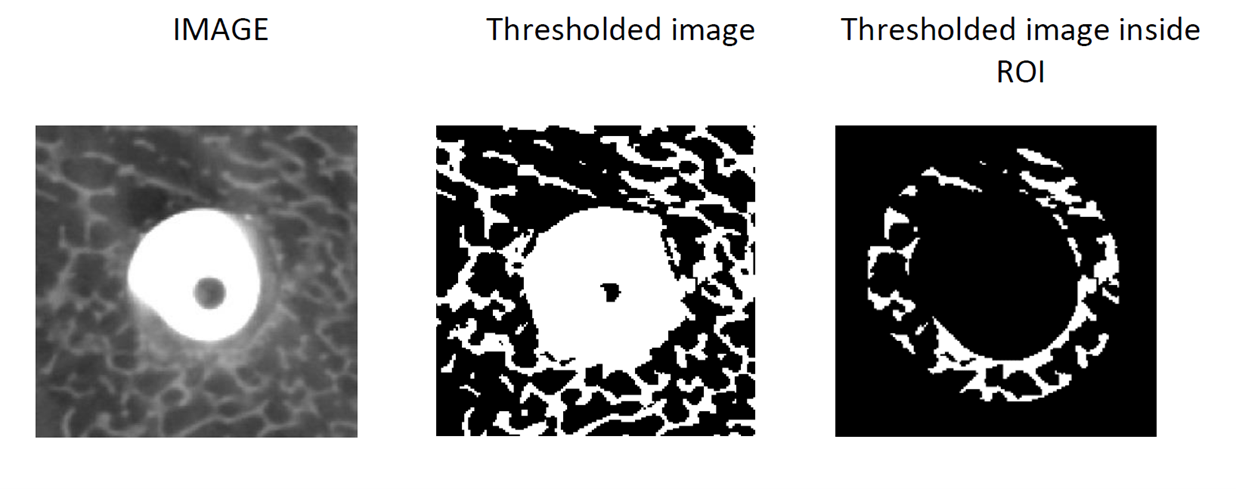
- Define a cylindrical or ring-shaped VOI around the implant surface.
- Standardize offset and height in number of slices to ensure comparability across samples.

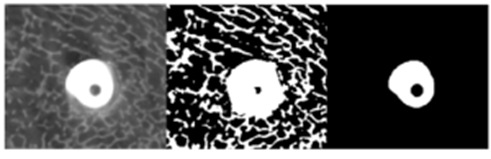
- Binary Segmentation
- Apply separate global thresholds for:
- Metal implant (high attenuation)

- Bone tissue (lower attenuation)
- Fill and dilate the implant binary to create a peri-implant mask.

- Metal implant (high attenuation)
- Apply separate global thresholds for:
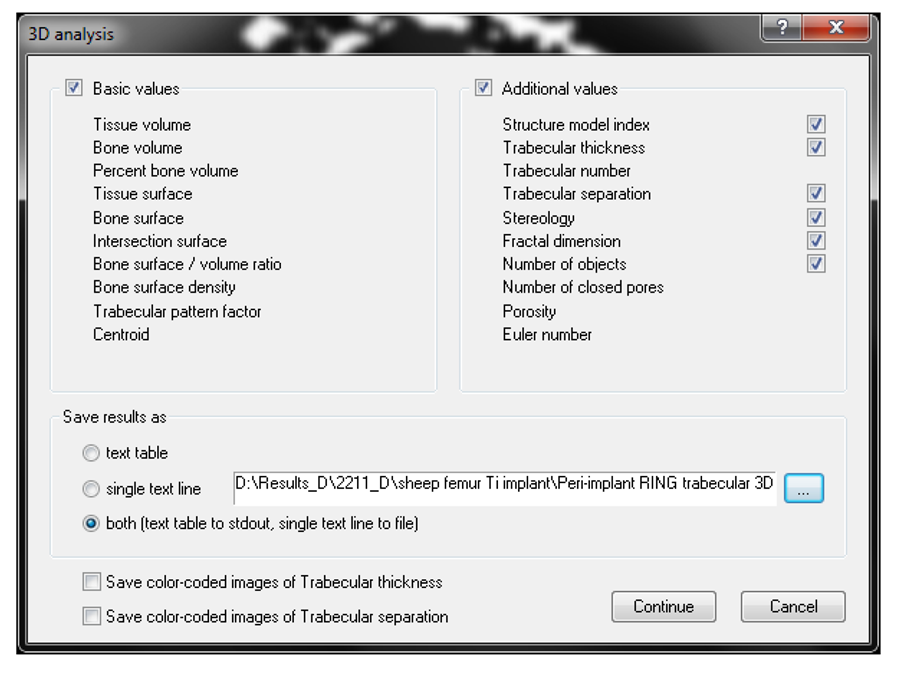
- 3D Peri-Implant Bone Analysis
- Measure:
- Bone volume fraction (BV/TV)
- Trabecular thickness, separation, and number
- Bone distribution as a function of radial distance from implant surface

- Generate surface-rendered 3D models for visualization.
- Measure:
- 2D Bone–Implant Contact (BIC) Analysis (Optional)
- Convert the dilated implant surface to a 2D perimeter.
- Calculate the percentage of implant surface in direct contact with bone versus non-bone tissue.

Methodology 3: Debris, Material Removal, and Untouched Surface Analysis in Endodontics
(Based on method note MN101 – Root Canal Debris and Untouched Surfaces)
Purpose: Quantification of dentin removal, debris accumulation, and canal wall coverage following root canal instrumentation using serial micro-CT registration.
Workflow and Analysis Steps
- Pre/Post Scan Registration
- Load before- and after-treatment datasets into DataViewer.
- Perform 3D registration and save transformation parameters for reuse.


- Root Canal Space Segmentation
- Binarize canal space in both reference and target datasets using inverse thresholding.
- Apply despeckle and sweep functions to clean segmentation.
- Save binarized canal datasets.

- Image Arithmetic for Material Changes
- Compute:
- Removed material = reference − target
- Debris (added material) = target − reference
- Visualize removed dentin (e.g., red) and debris (e.g., green) in 3D.
- Compute:


-
- Touched vs. Untouched Surface Mapping
- Create a 1-pixel boundary around the pre-treatment canal surface.
- Create a thicker (e.g., 3-pixel) boundary around the post-treatment canal to account for registration tolerance.
- Identify overlapping regions as untouched surfaces.

- Touched vs. Untouched Surface Mapping
- Quantitative Outputs
- Extract:
- Volume and surface area of removed dentin
- Volume of debris accumulation
- Percentage of untouched canal wall surface
- Correlate metrics with canal morphology and instrumentation technique.
- Extract:

As digital dentistry advances, micro-CT emerges not merely as a research tool, but as the structural framework upon which experimental rigor and clinical innovation depend.
Part 8:
From Research to Digital Dentistry
Although micro-CT remains primarily a research modality, its impact on digital dentistry is expanding through validation, modeling, and technology development. High-fidelity micro-CT datasets provide ground truth for clinical CBCT systems, inform finite element models of tooth–jaw biomechanics, and guide the optimization of instruments and restorative materials. In this role, micro-CT establishes a quantitative structural framework that underpins both experimental rigor and translational innovation.
As digital workflows increasingly integrate imaging, simulation, and fabrication, micro-CT-derived insights will continue to shape the evolution of dental research and advanced clinical technologies.
Although micro-CT is primarily a research modality, its influence on digital dentistry continues to expand. High-fidelity three-dimensional datasets serve as ground truth for validating clinical imaging systems, guiding finite element modeling of tooth–jaw interactions, and informing the design of instruments and materials. In this capacity, micro-CT bridges basic dental science and translational innovation.
As digital workflows increasingly integrate imaging, modeling, and fabrication, micro-CT-derived insights shape both experimental methodology and clinical technology development. Much as it has in zoology, orthopedics, and materials science, micro-CT establishes a quantitative structural framework upon which functional interpretation and therapeutic innovation are built.
Appendix A: References
- Hildebrand T, Rüegsegger P. A new method for the model-independent assessment of thickness in three-dimensional images. J Microsc. 1997;185(1):67–75. doi:10.1046/j.1365-2818.1997.1340694.x
- Bouxsein ML, Boyd SK, Christiansen BA, Guldberg RE, Jepsen KJ, Müller R. Guidelines for assessment of bone microstructure in rodents using micro–computed tomography. J Bone Miner Res. 2010;25(7):1468–1486. doi:10.1002/jbmr.141
- Metscher BD. MicroCT for developmental biology: a versatile tool for high-contrast 3D imaging at histological resolutions. Dev Dyn. 2009;238(3):632–640. doi:10.1002/dvdy.21857
- Versiani MA, Pécora JD, Sousa-Neto MD. Microcomputed tomography analysis of the root canal morphology of single-rooted mandibular canines. J Endod. 2013;39(9):1138–1143. doi:10.1016/j.joen.2013.04.004
- Peters OA, Paqué F. Root canal preparation of maxillary molars with the self-adjusting file: a micro–computed tomography study. J Endod. 2011;37(1):53–57. doi:10.1016/j.joen.2010.08.021
- Fagrell TG, Melin L, Norén JG. Molar incisor hypomineralization: a morphological study of hypomineralized enamel using micro–computed tomography. Swed Dent J. 2013;37(2):61–70.
- Pauwels R, Jacobs R, Singer SR, Mupparapu M. CBCT-based bone quality assessment: are Hounsfield units applicable? Dentomaxillofac Radiol. 2015;44(1):20140238. doi:10.1259/dmfr.20140238
- Faulwetter S, Vasileiadou A, Kouratoras M, et al. Micro-computed tomography: introducing new dimensions to taxonomy. ZooKeys. 2013;263:1–45. doi:10.3897/zookeys.263.4261
- Salmon P. Micro-CT as a quantitative tool for dental research and digital dentistry. In: Proceedings of the International Digital Dentistry Symposium. 2024.
- Barrett JF, Keat N. Artifacts in CT: Recognition and avoidance. Radiographics. 2004;24(6):1679–1691. doi:10.1148/rg.246045065
- Boas FE, Fleischmann D. CT artifacts: Causes and reduction techniques. Imaging Med. 2012;4(2):229–240. DOI:10.2217/iim.12.13
- Shemesh H, Bier CA, Wu MK, Tanomaru-Filho M, Wesselink PR. Dehydration induces cracking in root dentin irrespective of instrumentation: a two-dimensional and three-dimensional study. Int Endod J. 2018;51(4):409–416. doi:10.1111/iej.12835
