
Figure 1: Volumetric rendering of yeast dough sample
Density in bread and other porous foods is difficult to measure accurately, with true, apparent, and bulk being different types of densities based on how volume is measured. Predicting food density based on composition and processing conditions allows researchers to fill gaps in nutrient databases and account for new foods. Utilizing our Bruker SkyScan 1275 micro-CT scanner, which is specially designed for 3D high-speed imaging, we monitored the rise in a sample of bread dough with repeated scans every 20 minutes to measure changes in porosity over time.
X-Ray Microscopy Imaging of a Dough Ball
We imaged a ball of yeast-leavened pizza dough using the SkyScan 1275 desktop micro-CT. As can be seen from the view in Figure 1 above, the high-speed acquisition modes within the SkyScan 1275 allowed us to complete scans of the sample in under four minutes. With the speed of the SkyScan 1275 we were able to image the sample using 20 minute intervals to monitor the changes in dough porosity and pore size distribution over time as the yeast continued to produce more carbon dioxide gas within the dough. Using our volumetric analysis software, CTAn, we quantified these changes in both porosity and average pore diameter within the sample as the dough continued to rise in the instrument chamber.


Figure 2: Planar views of reconstructed data from the dough sample at the imaging start (top) and conclusion (bottom)
As shown in Figure 2, the dough rose outside our standard field of view used for the scan during the 80 minutes the sample was within the instrument. We can identify the dense dough ball at the start of imaging contained within the plastic housing with several large pores but overall a low porosity. After 80 minutes of proofing, the volume is significantly increased and while some large pores remain, many new, smaller pores are now present accounting for the rise in total volume of the dough.
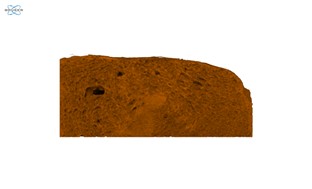

Figure 3: Clipped volumetric renderings of dough showing porosity at imaging start (top) and conclusion (bottom)
Since we wanted to make use of the ability to repeat scan settings for sequential samples, we also utilized the Push Button operation mode of the SkyScan 1275. After initially setting up our study and scanning parameters, we simply needed to push the button on the front of the instrument to repeat the image acquisition process under the same conditions at each timepoint. As we saw with the 2D image slices, we also observe the same large increase in porosity and sample volume when viewing the reconstructed 3D results (Figure 3).
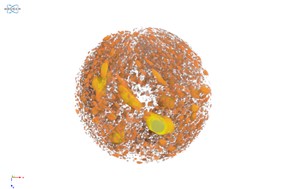

Figure 4: Clipped volumetric renderings of dough showing only pores colored by diameter at imaging start (top) and conclusion (bottom)
The pore size distribution and average pore diameters were calculated for all time points utilizing CTAn and the results can be visualized in 3D as a color-coded representation of the pores themselves from within the time point data (Figure 4). This image is the converse of Figure 3, in that we are viewing only the pores within the dough rather than any structural information from the dough itself. The visualization of the pores confirms our earlier observations that at the start of imaging the dough was compressed and low in porosity while after 80 minutes the dough shifted to a high porosity with most of the sample volume arising from new pores.

Figure 5: Calculated porosity at each timepoint within the field of view
The quantitative data within Figure 5 confirms our observations as well. The porosity increases from around 14% at the start of imaging all the way to above 80% at the conclusion of imaging.

Figure 6: Calculated pore size distribution at each timepoint within the field of view
Figure 6 provides data showing that during our imaging study the size distribution for the sample broadened slightly and increased in average pore diameter. These data also are in line with our observations, both visually within the 3D renderings and quantitatively with the total porosity for each sample.
Conclusion
The SkyScan 1275 allowed us to quickly capture structural volumetric data for a piece of dough as it continued to rise within the instrument chamber by making full use of the high-speed imaging modes. With a standard micro-CT, the dough would be moving too much due to the rising process to capture meaningful data. Some motion artifacts are present in these datasets even with the high-speed imaging modes as the dough is constantly in motion. However, the artifacts are minor overall and volumetric data can still be quantified from this sample time series. We hope you found this Image of the Month informative and encourage you to subscribe to our newsletter and social media channels in preparation for the continuation of our image of the month series next month.
Scan Specifications
| Sample | Yeast Dough |
| Voltage (kV) | 80 |
| Current (µA) | 100 |
| Pixel Size (µm) | 70 |
| Rotation Step | 0.4 |
| Scan Time (HH:MM:SS) | 00:03:34 |
These scans were completed on our high-speed desktop SkyScan 1275 system at the Micro Photonics Imaging Laboratory in Allentown, PA. Reconstructions were completed using NRecon while visualization and volumetric analysis of the 2D and 3D results were completed using Dataviewer, CTVox, and CTAn.
Would you like your work to be featured in our monthly newsletter? If so, please contact us by calling Seth Hogg at 610-366-7103 or e-mailing seth.hogg@microphotonics.com.