Figure 1: 3D Printed Support Structures After Mechanical Load Testing
As an accessory to the SkyScan instrumentation suite, Bruker offers several interesting accessories that can further support your research goals. In addition to accessory stages for cooling or heating of thermally conductive samples, Bruker has a range of mechanical testing stages for compression or tension testing of samples. This project utilized a 440N Bruker MTS2 testing stage along with our SkyScan 1275 to examine the effects of added loads to small, 3D printed support structures.
X-Ray Microscopy Imaging of Samples Under Mechanical Load
A one-centimeter cylinder was designed in CAD, and using Ultimaker’s Cura software three different infill geometries were selected covering the gyroid, triangle, and grid fill options. The cylinders were printed without an exterior wall so only the support structures were connecting the top and bottom of each cylinder. Each cylinder was printed using the same standard yellow PLA resin on a hobby level fused deposition modeling (FDM) printer. A 440N MTS2 was used for this work after installation in our SkyScan 1275 high-speed desktop micro-CT. The SkyScan 1275 is a great fit for this project due to the rapid acquisition times possible with each scan only consuming about 10 minutes of time.

Figure 2: Representative images of Cura infill patterns gyroid, triangle, and grid from left to right
Figure 2 highlights the differences in the infill patterns. The gyroid pattern is a smooth, wavy structure which constantly oscillates within the part. However, both the triangle and grid supports are more fixed in nature with the triangle fill for this cylinder producing a six-pointed star and the grid fill producing a four point grid with a single layer perimeter at the edges.

Figure 3: Planar 2D views through the gyroid support with no compression (left) and with 300N compression (right)
In inspecting the results from the gyroid fill, DataViewer provides us a live linked planar view through the three orientations of the sample before and after applying a 300N load (Figure 3). The images obtained after applying the load clearly show a full collapse of the structure.

Figure 4: Rendered 3D views of the gyroid support with no compression (left) and with 300N compression (right)
Likewise, we can better see the structure before and after collapse using CTVox (Figure 4). With an applied load of 300N, the gyroid structure suffered a complete collapse in this testing.

Figure 5: Planar 2D views through the triangle support with no compression (left) and with 300N compression (right)
In inspecting the results from the triangle fill, DataViewer does not seem at first glance to show a large difference before and after applying a 300N load (Figure 5). However, if you notice the coronal view after applying the load you will see that only a portion of the support is visible whereas the full support strut was visible prior to applying the load.
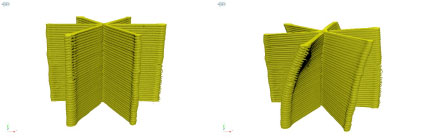
Figure 6: Rendered 3D views of the triangle support with no compression (left) and with 300N compression (right)
CTVox better helps us understand the changes that arose under the 300N load (Figure 6). Instead of collapsing like the gyroid fill, we see that the support struts in the triangle fill pattern began twisting in a counterclockwise direction. This twisting avoided a full collapse under the 300N load but pushing the load further over 400N led to the full collapse of the structure.

Figure 7: Planar 2D views through the grid support with no compression (left) and with 300N compression (right)
In inspecting the results from the grid fill pattern, DataViewer does not show a large difference before and after applying a 300N load (Figure 7).

Figure 8: Rendered 3D views of the grid support with no compression (left) and with 300N compression (right)
The results are further supported by CTVox where we see limited changes in local structure under the 300N load (Figure 8). This matches what we observe physically as well, as the sample was still relatively unchanged when removed from the MTS2 at the conclusion of testing. Thus, for this specific case the grid support pattern proved to be the most resilient to a linear load of 300N.Compared to the other structures, it’s likely that the outer perimeter ring provided the extra reinforcement needed to resist significant deformation under the applied load.
Conclusion
The SkyScan 1275 allowed us to rapidly image samples after applying a specified load using the scheduled scanning functions built into Bruker’s MTS2 compression testing stage. We successfully compared differences among three different structural infill patterns within FDM printed parts at controlled load values. We hope you found this Image of the Month informative and encourage you to subscribe to our newsletter and social media channels in preparation for the continuation of our image of the month series next month.
Scan Specifications
| Sample | 3D Printed Structures |
| Voltage (kV) | 40 |
| Current (µA) | 100 |
| Pixel Size (µm) | 15 |
| Rotation Step | 0.4 |
| Scan Time (HH:MM:SS) | 00:10:52 |
These scans were completed on our desktop SkyScan 1275 system at the Micro Photonics Imaging Laboratory in Allentown, PA. Reconstructions were completed using NRecon 2.1 and visualization of 2D and 3D results were completed using DataViewer and CTVox.
Would you like your work to be featured in our monthly newsletter? If so, please contact us by calling Seth Hogg at 610-366-7103 or e-mailing seth.hogg@microphotonics.com.
References