
Figure 1: Micro-CT volumetric rendering of a triggerfish imaged using the SkyScan 1273
To best match the wide range of sample sizes encountered in cataloging natural specimens, the SkyScan 1273 was used for this work to examine a small triggerfish as part of a larger subset of samples. The SkyScan 1273 accommodates samples from below a centimeter in diameter all the way up to 20 cm in diameter. This triggerfish was imaged as received as a hydrated sample wrapped in moist gauze to prevent dehydration during imaging. To capture the highest resolution view of the sample, two sequential vertical scans were captured along the length of the fish and digitally stitched together within NRecon.
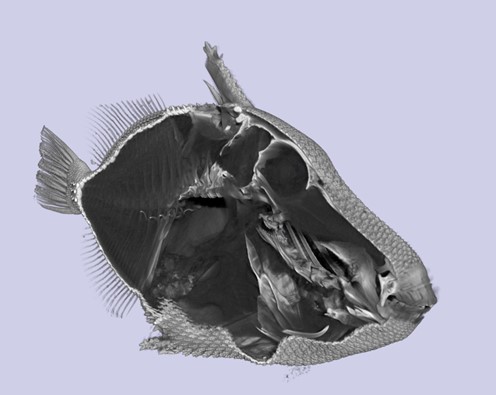
Figure 2: Clipped rendered volumetric view of triggerfish showing interior structures
As shown in Figure 2, the SkyScan 1273 captured the fine surface detail present in the scales of the triggerfish along with the bone and soft tissue regions inside the fish. The soft tissue within the triggerfish was not treated with any contrast agents, so since most soft tissue signal is indistinguishable due to a lack of contrast, we primarily are viewing the scales and bone. If the soft tissue regions were of interest to the examination, further work could be done in advance of scanning to add an appropriate contrast agent with selective binding to provide additional contrast.

Figure 3: Planar 2D views through the triggerfish
In inspecting the results from the triggerfish, DataViewer provides us a live linked planar view through the three orientations of the sample (Figure 3). In general, the scales and bones have a similar brightness in our reconstructed images while the soft tissue regions show up with less brightness since they attenuate less of the X-ray beam.
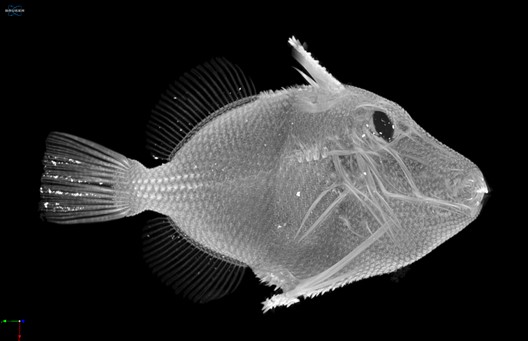
Figure 4: Maximum intensity rendered view through the triggerfish
Alternatively, we also can view the imaging results with CTVox in a maximum intensity projection (MIP) view to highlight the dense regions of our sample (Figure 4). In this case, the MIP view highlights the bones, teeth, and scales of the triggerfish as the densest regions of the sample.
Conclusion
The SkyScan 1273 is a versatile workhorse for zoological studies and characterizing many different species of animals with its flexibility to image the widest range of sample sizes in the Bruker desktop Micro-CT portfolio. We hope you found this Image of the Month informative and encourage you to subscribe to our newsletter and social media channels in preparation for the continuation of our image of the month series next month.
Scan Specifications
| Sample | Triggerfish |
| Voltage (kV) | 70 |
| Current (µA) | 214 |
| Pixel Size (µm) | 20 |
| Rotation Step | 0.25 |
| Scan Time (HH:MM:SS) | 01:36:56 |
These scans were completed on our desktop SkyScan 1273 system at the Micro Photonics Imaging Laboratory in Allentown, PA. Reconstructions were completed using NRecon 2.1 and visualization of 2D and 3D results were completed using DataViewer, CTVox, and CTAn.
Would you like your work to be featured in our monthly newsletter? If so, please contact us by calling Seth Hogg at 610-366-7103 or e-mailing seth.hogg@microphotonics.com.
The triggerfish sample imaged in this article was kindly provided by Dr. Terry Donaldson from the Marine Lab at the University of Guam. To contact this group related to their research, please reach out to Dr. Donaldson directly at tdonaldson@triton.uog.edu. We thank the Donaldson group for contributing to this image of the month article.