The food processing and manufacturing industry utilizes micro-CT analysis in several ways, from studying the distribution of ingredients within products to inspecting finished packaging for foreign materials and checking product distribution within the packaging. Further, micro-CT allows researchers to study intact internal microstructure data non-invasively, as we were able to demonstrate with this examination of canned sardines packed in oil. Utilizing our SkyScan 1275 desktop micro-CT, we were able to quickly image the can of sardines, taking a virtual look within the dense metal container while resolving the fine structures of the bones within the fish.
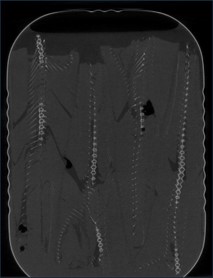
Micro-CT Scan of Canned Sardines Packed in Oil
Our micro-CT visualization of this canned sardine sample packed in oil provides a useful example of the inspection of packaged food products. As can be seen in Figure 1 above, while we receive the most signal from the can, fine details in the bones and tissue can still be resolved without the need to open the package or add any additional contrast agents or stains.

As can be seen in Figure 2, five regimes are visible in the scan results. These five regimes can be separated into air, the metal signal from the can, the signal from the bone, the tissue from the fish, and the slightly lower intensity signal from the oil surrounding the fish within the container.

Using the reconstructed results, the sample can be digitally inspected from any perspective, as we can see in Figure 3. In this view, we digitally sliced away the lid of the can to reveal the location of the fish within the package.

Visualizing the internal contents of packaged foods may be helpful for understanding packing within the container, product condition after processing, the presence of any foreign contaminants, or other useful features. It is also possible to go one step past just simply visualizing the results to segment the relevant regimes for further analysis or to isolate features of interest, as shown in Figure 4.

Adjusting the opacity of the different segmented regimes allows us to visualize the different components of the sample including the bones, can, flesh/water regime, and oil regime (Figure 5). Each of these regimes could be independently exported to a volumetric file format such as STL for further analysis or for additive manufacturing.
Conclusion
The high-speed micro-CT imaging that is possible using the SkyScan 1275 is particularly suited towards food inspection applications allowing for non-destructive imaging of samples pulled straight from the production floor or from store shelves. We hope you found this Image of the Month informative and encourage you to subscribe to our newsletter and social media channels in preparation for the continuation of our image of the month series next month.
Scan Specifications
|
Sample |
Sardines Packed in Oil |
|
Voltage (kV) |
80 |
|
Current (µA) |
125 |
|
Pixel Size (µm) |
45 |
|
Rotation Step |
0.2 |
|
Scan Time (HH:MM:SS) |
00:53:33 |
This scan was completed on our high speed desktop SkyScan 1275 system at the Micro Photonics Imaging Laboratory in Allentown, PA. Reconstructions were completed using NRecon and visualization of 2D and 3D results were completed using Dataviewer, CTVox, syGlass, and Simpleware software.
Would you like your work to be featured in our monthly newsletter? If so, please contact us by calling Seth Hogg at 610-366-7103 or e-mailing seth.hogg@microphotonics.com.