William C. Reese
Laboratory Professional & Micro-CT Specialist
ExxonMobil Technology and Engineering Company
To highlight various applications of micro-CT technology, Micro Photonics is featuring monthly Q & As with investigators working in both life science and materials science. We continue this series with an interview with William Reese, who uses micro-CT technology for defect analysis and quantitative evaluation in the oil and gas industry.
Can you explain broadly about how geology is applied to the exploration and production of oil and gas?
Because petroleum reservoirs are found primarily within sedimentary rocks, petroleum geology mostly involves the study of sandstones, carbonates, and mudstones. Studying the permeability, porosity, structural integrity, and mineralogy of sedimentary rocks helps us understand how petroleum is transported and stored in the reservoir. Understanding these properties helps predict and enhance producibility of the reservoir. Our work is primarily research but is often complimentary to active work in the field
I know you are scanning geological materials in an oil and gas laboratory. Can you expand on the materials and testing you are doing?
When a company drills a well, a lot of times there are questions surrounding how to best handle the drilling and production of the reservoir, especially in new areas. The best way to handle this is by collecting whole core samples. Whole Core is obtained by switching out a standard bit, which produces cuttings, to using a hollow bit that collects the whole core sample. The whole core is then sent to the laboratory where analytical testing can begin.
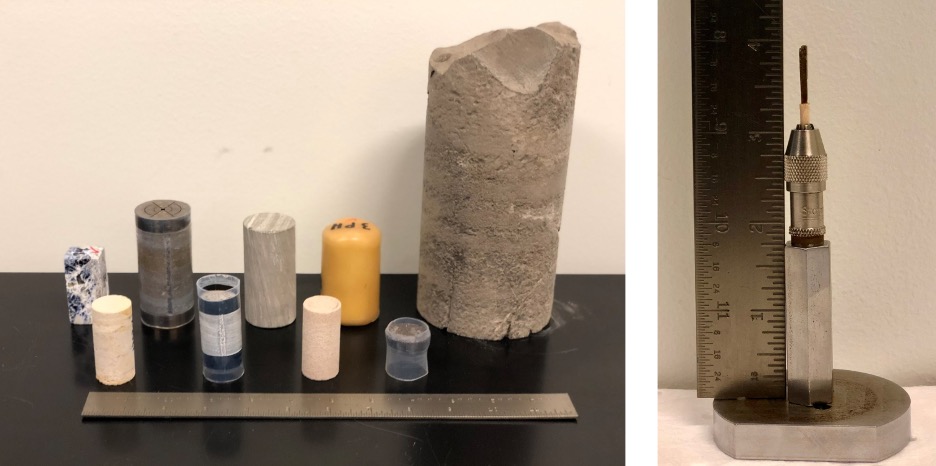
The whole core sample is typically four inches (~10cm) in diameter and hundreds of feet or meters long. From that, smaller samples are taken, which are called core plugs. I primarily receive core plugs from wells all over the world that the lab is going to be working on. These are typically 1” or 1.5” diameter and the length is typically anywhere between 1-3”.
While most of the samples I scan are rocks, I work with other materials as well. I have scanned a lot of steel samples for pipelines. I have also worked with plastics/composite materials (think plastic bottles, household items) and polymers (think tire rubber).
Can you give some specific examples of how you are using micro-CT technology?
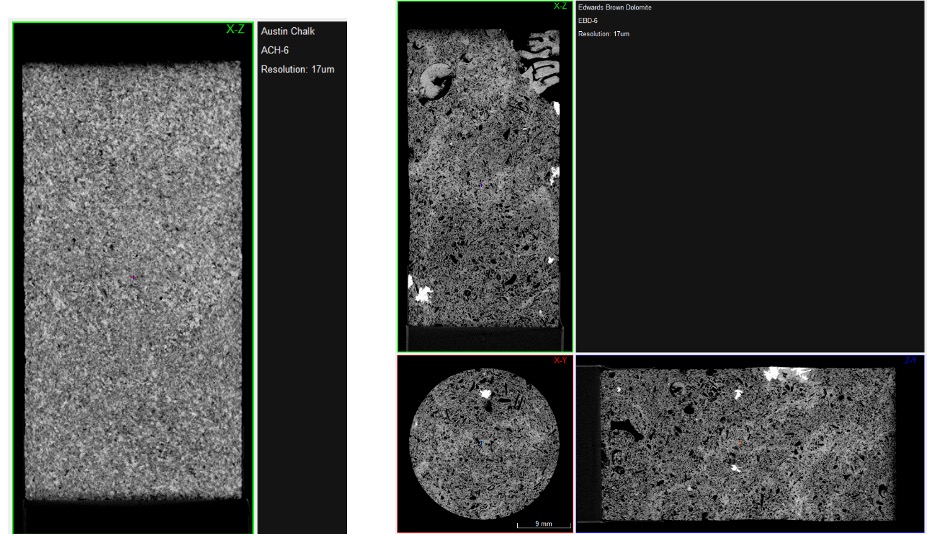
A large portion of my work is quality control for the sample core plugs. Are there any fractures, or are there any defects that could affect further testing in any way? These defects can affect the test results in whatever lab they’re going to next (e.g., flow studies or strength testing).
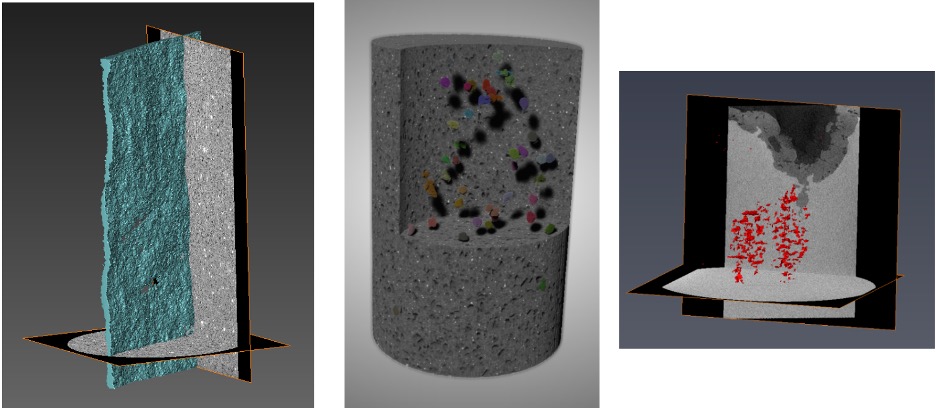
I also do quantitative work for geological materials. This type of scanning has been very project-specific so there isn’t one set analysis or standard, but one example is studying the pore space (void space) in a rock sample. The pore space or porosity is where hydrocarbons are stored so understanding the pore space and its connectivity, or lack of connectivity, is extremely important. Being able to visualize the porosity in 3D with the use of micro-CT is a huge help to researchers.
The steel scans that I have been doing are for corrosion and failure analysis to help better understand how pipelines fail and learn which materials withstand corrosion best.
The scans of plastics and polymers have been to help identify defects or failure analysis.
What are the challenges for micro-CT scanning of geological samples?
For quantitative analysis, it is difficult to scan a full size plug (1”d x 2”l) and be able to truly capture all of the aspects of the sample. For example, a mudstone or shale sample is going to be very tight, and the pores and pore throats are going to be as small as a few nanometers, but there will also be pores that are much larger in size, 10s to 100s of microns. This makes quantification difficult because, in this example, to properly image the full range of porosity the scan needs to be at such a high resolution to catch the small pore spaces that it is too high of a resolution to image the entire sample. If the resolution is low enough to catch the whole sample, I can’t see or quantify the smaller features or pore spaces. Another example of features of interest would be fractures or microcracks in rock samples.
How have you been able to overcome these challenges?
For this challenge, we have looked at a few options. First, we can scan a sample at full field of view, scout an area to capture the micro- and nano-porosity, and zoom in on those areas. This isn’t ideal, but it still allows us to visualize and quantify the microporosity, even if it’s just in a subset of a sample. Another option is to use complimentary test methods to help tell the story. For example, RCAL data (porosity/perm and MICP) can be used in conjunction with the micro-CT analysis. The micro-CT captures the macro porosity and gives us X% and the RCAL data will show what was missed. It’s not perfect and would be a rough estimate, but it helps tell the story of the rock formation.
What are the goals for your lab and other similar labs in the field of petroleum geology today?
The big problem or goal that people are working towards is applying micro-CT in a way that helps predict reservoir behavior. Digital rock physics (DRP) or analysis allows us to run flow models through a sample or allows us to understand the mechanical properties of a sample, all the way up to modeling reservoir behaviors. There are multiple problems with DRP but, to put it simply, it is a complex scaling issue. It’s hard to get a scan or scans that scale appropriately to the full scale of a reservoir. It goes back to not being able to scan nano-porosity and macro-porosity in the same scan. Also, fractures in reservoirs make DRP more uncertain, and an understanding of various rock properties like mineralogy are also needed to properly build these models.
Are there any images that you could share illustrating results using micro-CT with your applications?
Quality Control Examples:
Quantitative Analysis Examples:
Geologic Materials Examples:
What has been the most interesting finding from your work?
Personally, I really enjoy the quantitative analysis aspect. I can’t say I ever really know what I’m going to find, so it’s always a surprise when I start segmenting and seeing the volume in 3D. Also, a fun thing with rocks is that every now and then you find fossils, or features left behind by ancient critters (ex. burrows), or complex fracture systems that get cemented with pyrite or calcite.
May we cite key publications for further reading?
More Information:
To contact William Reese, please email: william.c.reese@exxonmobil.com.
If you are interested in being featured in a future Researcher Spotlight, please contact ann@microphotonics.com. We love to hear how our instruments are being used in the field!